The Waiting time vs. Processing time per case graph requires the following changes:
- Depict only the top 50 cases with the lowest CTE in ascending order.
- Remove the scroll bar.
- Change the title to "Top 50 cases with the lowest CTE".
- Flip the colors of the lines: PT -- in blue, WT -- in orange.
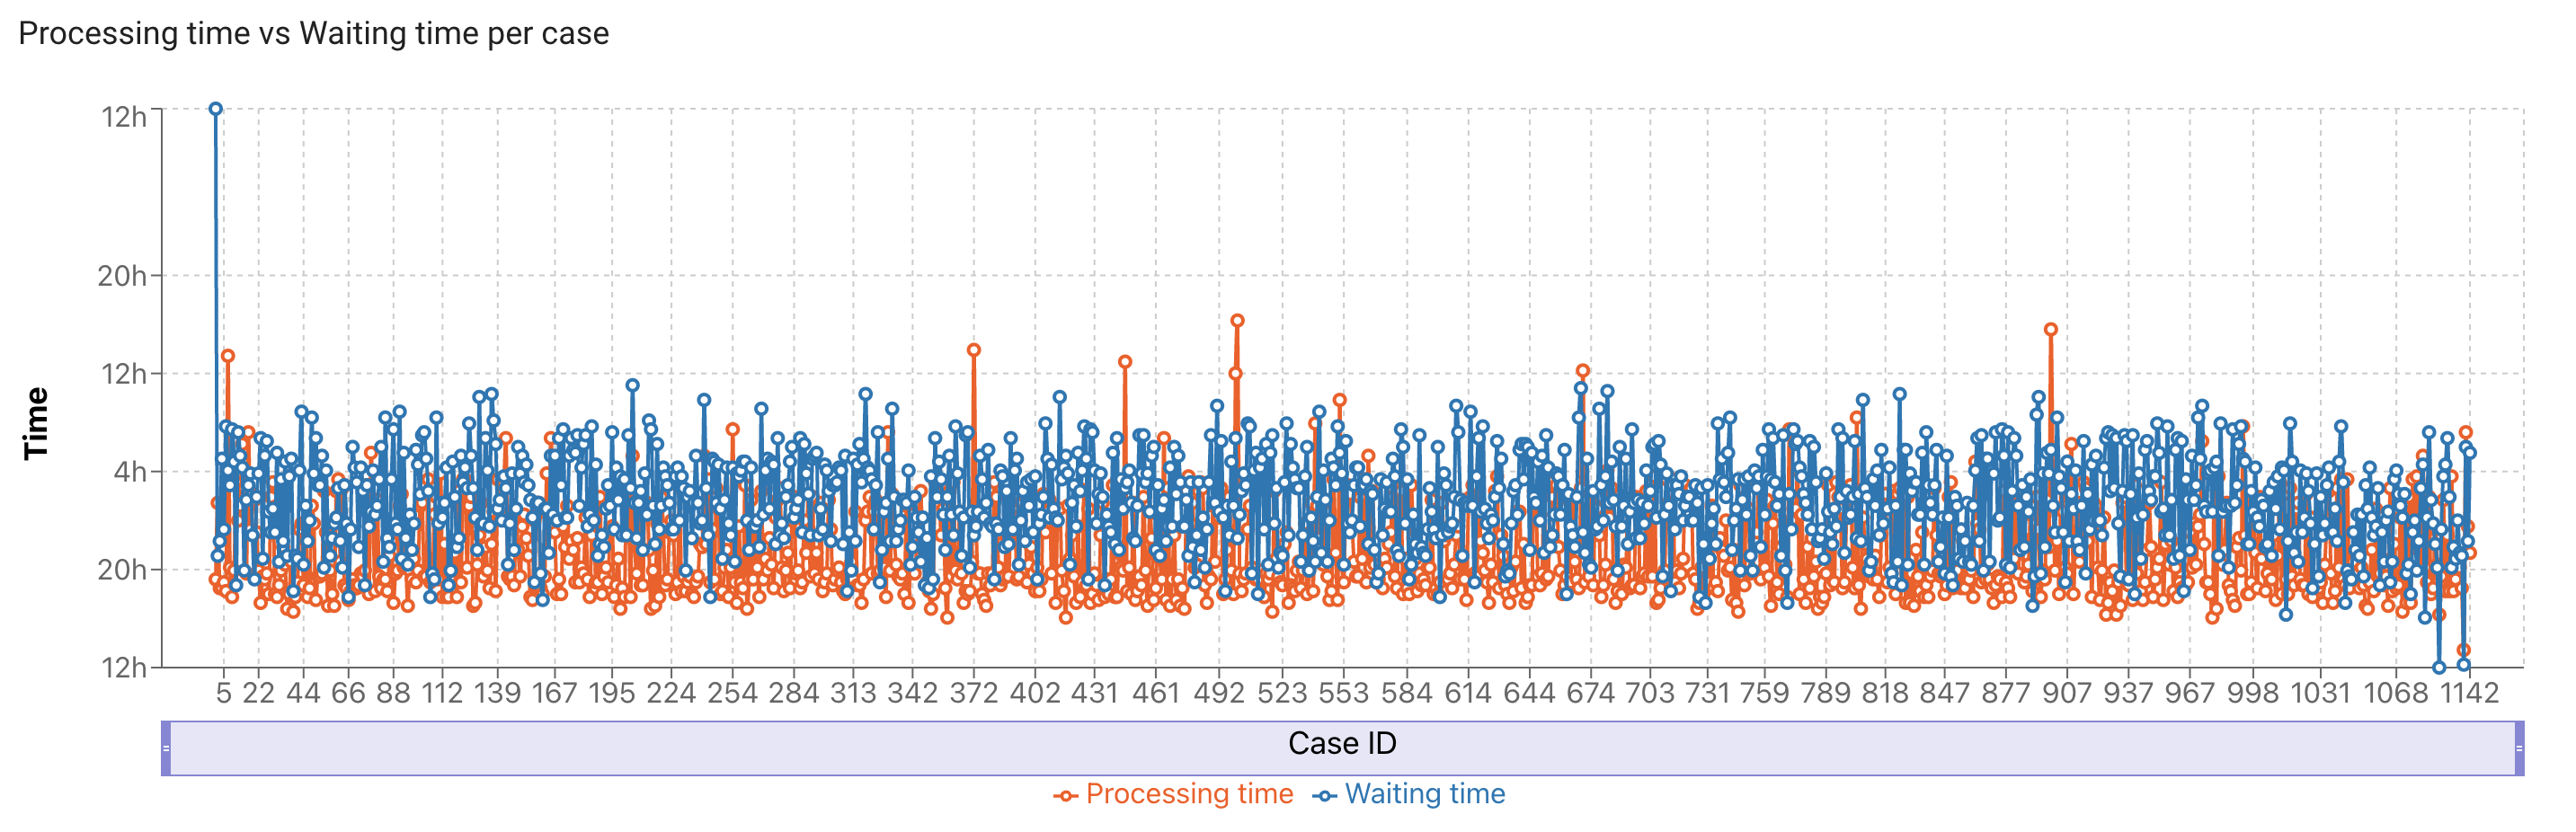
- Check the values of the y-axis. Sometimes it produces weird values (e.g., in the Device.Repair.csv log in the picture below). Note that I tested it after the scale had been reported fixed.
The Waiting time vs. Processing time per case graph requires the following changes: