24 Juni, 2018
- The Scientific Workflow (Source: http://r4ds.had.co.nz/introduction.html)
- SPT's for scientific writing
- SPT's for statistical and data analysis
- SPT's for visualization
- SPT's for presentations
- SPT's that bring 'em all together
- Miscellaneous SPT's
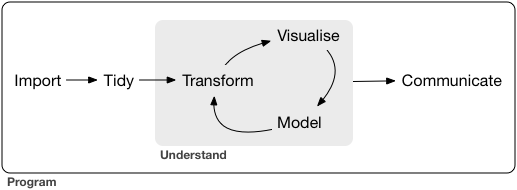
Test This is a collection of useful software, programs and tools (SPT's) that in some way or another help ease the scientific workflow. While the term "scientific workflow" may mean different things to different disciplines, I explicitly assume a data-driven workflow which implies that at some point within the process of answering a scientific question, data comes into play. While studying the scientific workflow as such is interesting - especially from a developers perspective - it is sufficient to think of it as a circle of three mutually dependent parts:
- Get, manage, and clean data
- Analysis data - Visualize, model, transform
- Communicate results - Write, present, share
This is nicely summarized in the following graphic that has been popularized by Hadley Wickham, the author of many useful R packages and excellent books (see below).
The Scientific Workflow (Source: http://r4ds.had.co.nz/introduction.html)
When talking about SPT's that help ease the scientific workflow I have this workflow in mind.
The SPT's are roughly grouped by their main purpose, although this is by no means a sharp distinction as most SPT's are useful for different tasks within the circle. Help, documentation, tutorials and examples for each of the SPT's mentioned below may easily be found on Google.com. I will, however, mention recommended reading if I find something particularly useful.
Scientific writing poses challenges that regular word processors such as Microsoft Word or OpenOffice are not designed for, most notably
- extensive use of mathematical characters and symbols
- ability to control the layout in detail
- state of the art style requirements
- convertibility between different formats (e.g. .pdf and .html)
- reproducibility and cross-platform independence
- seamless integration with other SPT's within the scientific workflow in particular the connection between computer code/output and writing.
LaTeX is a free and open-source high-quality typesetting system. It may be used for pretty much anything related to typesetting whether it is a short technical paper or presentation trenched in mathematical symbols, graphs and tables or a lengthy book with many chapters and detailed style guidelines. Since LaTeX includes features that are explicitly designed for the production of technical and scientific writing (e.g. mathematical notation and detailed control of the bibliography), it excels at that and has hence become the de facto standard for the communication and publication of scientific documents. While learning LaTeX requires more effort than learning Microsoft Word (at least initially) it has many advantages that make the initial effort worthwhile, in particular for those that regularly use mathematical notation.
Installation:
Recommended Editors: TeXMaker, TeXstudio
Markdown is a very simple markup language with plain text formatting syntax that was designed to be as easy-to-read and easy-to-write for humans as possible. Originally, documents written in standard Markdown were only intended to be converted to HTML, however, in particular with the introduction of Pandoc, the number of formats increased significantly now supporting well known formats such as .pdf and .docx (Microsoft Word). Markdown is standard in most scientific forums and platforms, most notably StackOverflow and GitHub, although each of them uses a different Markdown dialect (extension). The number of different dialects that have evolved since the original Markdown language was first introduced in 2004 may be a bit confusing to newcomers, however, they are largely compatible amongst each other.
Text written in Markdown is basically regular text with some additional "comments" like "#" that tell the processing engine what it should do with the text (in this case: "#" tells the engine to convert the line following the "#" to the appropriate html code indicating a first-level header). Allowing only a small set of such "comments", it is easy to learn, yet powerful enough to cover most of the formatting tasks you usually want to do while leaving the rest to more advanced programs such as LaTeX. In this respect, although fundamentally different, it may be seen as at "LaTeX-light".
The major advantages of Markdown, besides simplicity, are state of the art styling, convertibility, and seamless integration with other SPT's such as R, GitHub, Jupyter or Shiny.
Installation: none needed
Recommended Editor: Atom,
RStudio
Statistical analysis is at the heart of the answer to most scientific questions. This is especially true for questions related to economics and/or businesses management. While classical statistical and econometric theory does not necessarily require the use of computer software, actual application and data analysis in general is inherently computer driven. Furthermore modern statistics (like neural nets or Monte Carlo simulation) by and large evolved around computer driven progress and may thus be seen as inherently computer-dependent. This is emphasized by a quote in the 2016 book Computer Age Statistical Inference by Bradley Efron and Trevor Hastie, two of the most famous statisticians/computer scientists:
Almost all topics in twenty-first century statistics are now computer-dependent [...]
Hence, a set of SPT's that help built, explore, evaluate, and interpret models of any complexity is therefore indispensable. While standard spread sheet programs such as Microsoft Excel do have its benefits, it is important to realize that they are not designed for more complex statistical tasks. Additionally, they usually only poorly integrate with other SPT's, which is a major obstacle in the scientific workflow. See e.g. this post.
R is an open-source software environment for statistical computing and graphics. It is a primarily a command language, although a graphical user interface (GUI) called RCommander may be used. Compared to software such as EViews, Stata, SPSS or Gretl it has a relatively steep learning curve - although the initial hurdle has been considerably lowered over the last years, thanks to tutorials, introductory videos, well written books and tons of detailed and easy-to-read documentation. The learning curve is usually an obstacle for those new to R, however, as mentioned above and as described here and here, there are numerous reasons why R should nevertheless be your pick as statistical software, most notably:
- It is free
- R forces you to think about what you want to do
- By seamlessly integrating with other SPT's R open the door to a world of other SPT'S (and incredibly important aspect that as of March 2017 no other software is able to beat)
- Conceptually intuitive, uniform data cleaning and transformation
capabilities (thanks to the tidyverse
(including packages such as
dplyr,tidyr,purrr,readrandmagrittr) and its underlying philosophy as described in this paper by Hadley Wickham), unparalleled visualization possibilities (thanks to packages suchggplot2and (in the future)ggvis), and almost every model function you can think of (thanks to over 6000 packages on CRAN alone as of April 2016). - A vibrant and helpful community.
Installation: CRAN
Recommended Editor: RStudio
Recommended Reading:
- Norman Matloff: The Art of R Programming
- Hadley Wickham: R for Data Science
- Hadely Wickham: Advanced R
Stata is a powerful commercial software for data analysis and graphics. It has a relatively simple syntax mitigating the initial pain associated with learning a new language. Stata has outstanding documentation for its functions as well as for the mathematical concepts underlying these functions. There are good reasons to learn Stata and in fact, I think mastering both Stata and R is ideal as it allows to combine the best of both.
Visualization is an integral part of the data analysis. Proper visualization does not only help to summarize what you already know but
it forces us to notice what we never expected to see (John Tukey).
While there are many aspects to what makes visualization good (see e.g. this brilliant book by Stephen Few, or literately anything written by Edward Tufte), this section only describes helpful tools to be used in creating objectively good and meaningful visualizations.
ggplot2 is the R package for producing statistical and/or data graphics, written by Hadley Wickham, one of the most productive - if not the most productive - member of the R family. It has become the de facto standard for displaying graphics made with R. Unlike most other graphics packages in R - or any other statistical program for that matter - it does not only provide a set of commands useful to produce beautiful, hassle-free graphics but aims higher by building on a deep underlying grammar of graphics. This is what makes ggplot2 so powerful! Learning the grammar will not only help new users to master the many commands used in producing a high class graphic, but will also force you -or, to put it more mildly, help you- to think about what a specific graphic should contain. The importance of ggplot2 cannot be overstated and should be a must-use for any serious visualization attempt .
Installation: install.packages("ggplot2") in your R console
Recommended Reading:
- Hadley Wickham: ggplot2: Elegant Graphics for Data Analysis
- Hadley Wickham: R for Data Science
- Winston Chang: R Graphics Cookbook
- Data Visualization Cheat Sheet
TikZ is a Tex package that offers a huge amount of commands to produce vector graphics of any kind. As TikZ is to be used in (La)TeX, fonts and appearance beautifully go along with that of LaTeX. Once installed, learning TikZ is comparably simple but can be quite time consuming when a certain flexibility is needed. There is a great documentation for all of TikZ features but being more than 1200 pages strong, this documentation is overwhelming at first but very helpful once you know your way around its content.
Installation: usepackage(tikz) in your LaTeX preamble.
Recommended Editor: TikzEd,
TeXMaker
Shiny is an R package created by RStudio that provides a framework to build beautiful, interactive web application without extended knowledge of HTML, CSS or JavaScript. The commands necessary to write basic and intermediate shiny application are surprisingly easy to learn, however, a working knowledge of JavaScript and HTML is probably very handy for more complex projects. As all the statistical work is done in R, a proper knowledge of how to do things in R is required. While Shiny is by no means confined to visualization, it is particularly helpful when combined with ggplot2 to produce beautiful graphics that can be changed on the fly.
Installation: install.packages("shiny") in your R console
Recommended Editor: RStudio
Recommended Tutorial: The best way to learn Shiny is to use the
tutorial on the Shiny webpage.
Recommended Reading: Interactive web apps cheat
sheet
and literally anything that Dean Attali
writes.
The beamer class is used to create presentation slides with LaTeX. As it is a LaTeX class, it is perfectly suited for high-quality presentations that make extensive use of mathematical notations and symbols and require fine control over the appearance.
Installation: A working LaTeX
installation such as MikTeX.
Recommended Editor:
- TexMaker if you want to create the presentation directly with Latex.
- RStudio if you want to create a beamer
presentation from an R Markdown file using
beamer_presentationin you YAML header.
Recommended Reading: Beamer User Guide
Both IoSlides and Slidy are web-based alternatives to standard pdf
presentations. IoSlides or Slidy slides are basically html pages that
can be run directly within the browser. This makes them highly shareable
and portable. Slides are best from within RStudio created by knitting an
R Markdown file using ioslide_presentation or slidy_presentation in
your YAML header.
Pandoc is a universal markup language document converter written by John MacFarlane. You can pass any documents written in a markup language like LaTeX, Markdown, HTML to Pandoc and convert these from one format to another including different slide show formats, HTML code and pdf (try it out yourself here. Pandoc works best, however, if given a (R)Markdown file as input. Pandoc is not that easy to use (requires a command line) but as it is nicely integrate into the RStudio IDE via the R Markdown package, there is usually no need to use it directly, although its good to know that it exists in case you need it.
First of all, Knitr is an R package. More importantly, however, it is a general-purpose literate programming engine. Literate programming is a term coined by Donald Knuth the creator of the TeX typesetting system. It basically centers around the idea that programming does not only consist of writing many lines of code but, equally important, it involves writing a narrative that explains what the code actually does and how the program or its functions are supposed to be used. Traditionally, this was done by either writing comments directly in the source file, or by writing a separate documentation. The former has the obvious drawback of being limited to almost no formatting possibilities and requires the readers to be able to open and understand the source file. While the latter approach is better it still has major shortcomings, mainly:
- it involves lots of human effort (copy-and-pasting)
- it is error-prone due to copy-and-pasting
- inherently static: if results depend on previous results, the whole chain has to be manually rewritten if any of the results within the chain are changed.
- it is likely to produce layout conflicts and inconsistent styling which
Knitr enables the use of both program code and sophisticated comments within one single document. Although Knitr is an R package it does not only support R but the most often used document formats such as LaTeX, HTML, Markdown and a broad variety of other programming languages such as Python, Julia or even (after some tweaking) Stata. Knitr is tightly integrated into RStudio but does not depend on it.
Recommended Reading:
- Yihui Xie - Dynamic Documents with R and knitr
R Markdown is an R package that is usually referred to R Markdown v2 to distinguish it from an earlier version. It basically brings Markdown, Knitr and Pandoc together. It enables easy creation of dynamic documents (via Knitr) in different formats (via Pandoc) including Pandoc's version of the Markdown language. Similar to Knitr, it is tightly integrated into the RStudio IDE making it extremely easy to use (literally one click is sometimes enough). Recommended Reading:
- This is a very good, detailed but also long intro to RMarkdown and reproducible research in general.
- R Markdown cheat sheets
As explained on its homepage Jupyter is a web application that allows you to create and share documents that contain live code, equations, visualizations and explanatory text. Uses include: data cleaning and transformation, numerical simulation, statistical modeling, and much more. While its predecessor, IPython notebook, was only built to work with Python, Jupyter supports many other languages such as Julia and R, although both Kernels are still in its early stages. This is, by the way, where the name is coming from, as Jupyteris an acronym for Ju(lia)Py(ton)te(R). The difference between knitr and Jupyter is that the latter allows for live code and text evaluation. While R Markdown files need to be compiled for evaluation to take place, code cells in a Jupyter notebook are evaluated on the fly. This makes Jupyter highly recommendable for interactive teaching of programming since students can follow live and take notes while the instructor dynamically changes the code in response to questions and suggestions.
Installation:
GitHub is primarily a code sharing and collaboration platform that is build around Git, a highly sophisticated version control system that is nowadays used by many open source developers worldwide. While developing software is probably not really that interesting to students, GitHub is nevertheless very useful when working together on a project that involves writing code of any kind. Even when not working on an own project, knowing your way around GitHub is indispensable when you have an interest in anything related to coding as this would sooner or later lead you to GitHub .
Installation: Start here
Virtual Box lets you set up a virtual machine on your local computer. This is especially useful if you want to have Linux running in parallel on a windows machine (or the other way around) and don't want the inconvenience of a dual boot machine. When setting up the machine the user can choose how much of the computer resources (such as RAM, Disk Space etc.) the virtual machine should be able to use.
ShareX is a free, modern screen capturing, screen recording tool. The tool allows capturing a screenshot in a variety of modes, such as full screen, window, monitor, rectangle, polygon and more. ShareX also offers various after-capture tasks like annotating, adding effects, watermarking, uploading and printing. It conveniently saves screenshots as a regular .png or as url for immediate sharing.
JabRef is a jave-based open source bibliography reference manager that helps you organize your books, papers and other documents. It is designed to work with LaTeX as it stores its information in LaTeX' native BiTeX style. Hence, it is the ideal tool for storing and organizing your LaTeX bibliography.
PureSync is a free software - for personal use only, a professional version is available but not necessary - that lets you automate internal and external files and folders synchronization on your computer. This is usually only of interest to Windows users as Mac offers a nice standard backup system. There are many similar programs that might be equally good.