forked from alexafarraj/Tidy-Tuesday
-
Notifications
You must be signed in to change notification settings - Fork 0
Expand file tree
/
Copy pathedgeR_workflow.Rmd
More file actions
96 lines (68 loc) · 2.68 KB
/
edgeR_workflow.Rmd
File metadata and controls
96 lines (68 loc) · 2.68 KB
1
2
3
4
5
6
7
8
9
10
11
12
13
14
15
16
17
18
19
20
21
22
23
24
25
26
27
28
29
30
31
32
33
34
35
36
37
38
39
40
41
42
43
44
45
46
47
48
49
50
51
52
53
54
55
56
57
58
59
60
61
62
63
64
65
66
67
68
69
70
71
72
73
74
75
76
77
78
79
80
81
82
83
84
85
86
87
88
89
90
91
92
93
---
title: "edgeR Workflow for differential gene expression analysis"
author: "Erin Chille"
date: "10/24/2021"
output: html_document
---
```{r setup, include=FALSE}
rm(list = ls()) #clear environment
```
## Overview
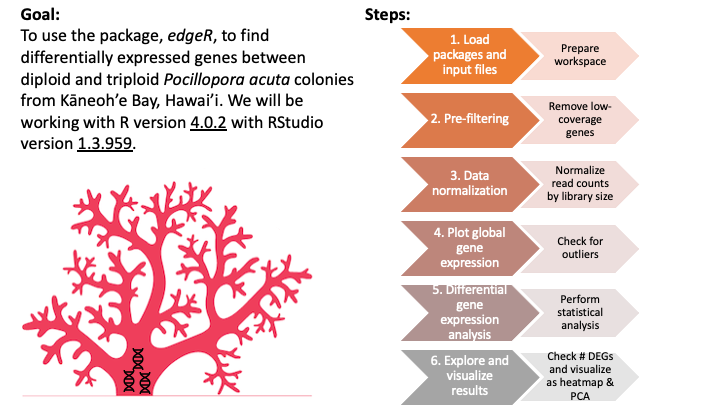
## 1. Load packages and input data
Load packages
```{r, message=FALSE, warning=FALSE}
library(edgeR, quietly = TRUE) #edgeR-v3.30.3
library(ggplot2, quietly = TRUE) #ggplot2-v3.3.5
library(tidyverse, quietly = TRUE) #tidyverse-v1.3.1
```
Load the input file containing the treatment information
```{r}
#treatment information
treatmentinfo <- read.csv("/Users/erinchille/Documents/Rutgers/DBlab/repos.nosync/Triploid-Pacu-Gene-Dosage/Sample_Info/Master_Fragment_Drive_Sheet.csv", header = TRUE, sep = ",") #read in file
# treatmentinfo$Ploidy <- gsub("2", "Diploid", treatmentinfo$Ploidy) #change 2 to Diploid
# treatmentinfo$Ploidy <- gsub("3", "Triploid", treatmentinfo$Ploidy) #change 3 to Triploid
str(treatmentinfo); head(treatmentinfo) #view dataset attributes
treatmentinfo.ATAC <- filter(treatmentinfo, Treatment=="ATAC")
treatmentinfo.ATAC <- filter(treatmentinfo.ATAC, Species=="Pacuta")
dim(treatmentinfo.ATAC)
```
Load the input file containing the gene count matrix
```{r}
#gene count matrix
gcount <- as.data.frame(read_delim("/Users/erinchille/Documents/Rutgers/DBlab/repos.nosync/Triploid-Pacu-Gene-Dosage/Sample_Info/gene_counts.tsv", delim = "\t", col_names = TRUE, show_col_types = FALSE)) #read in file
rownames(gcount) <- gcount$Name #makes "Name" the rowname
gcount <- gcount[,-c(1)] #drops the "Name" column
gcount <- round(gcount) #round
dim(gcount); head(gcount)[,1:3] #view dataset attributes
```
Determine library size
```{r}
gcount.ATAC <- gcount[,treatmentinfo.ATAC$SampleID]
libSize.df <- data.frame(libSize=colSums(gcount.ATAC))
```
```{r}
DGEdat <- DGEList(counts=as.matrix(gcount.ATAC), samples=treatmentinfo.ATAC, group=treatmentinfo.ATAC$Site.Name, lib.size = libSize.df$libSize)
```
## 2. Pre-filtering
```{r}
keep <- rowSums(cpm(gcount) > 3.33) >= 2
table(keep)
DGEdat <- DGEdat[keep, , keep.lib.sizes=FALSE]
```
## 3. Data normalization
```{r}
DGEdat <- calcNormFactors(DGEdat)
DGEdat$samples
```
## 4. Plot global gene expression
## 5. Differential gene expression analysis
Check for effect of TimePoint
```{r}
DGEdat$samples$Ploidy <- factor(DGEdat$samples$Ploidy, levels = c("Diploid", "Triploid"))
DGEdat$samples$TimePoint <- factor(DGEdat$samples$TimePoint)
design <- model.matrix(~TimePoint+Ploidy, DGEdat$samples)
logFC <- predFC(DGEdat,design,prior.count=1,dispersion=0.05)
cor(logFC)
```
## 6. Explore and visualize results