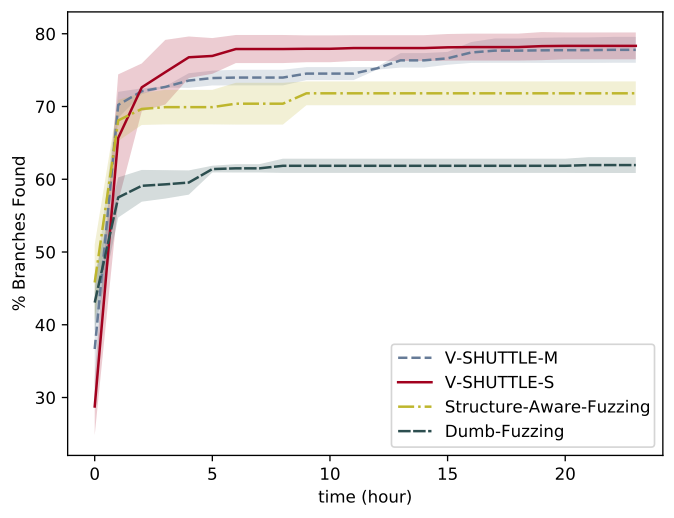
Clarifications on the Fig7(b) #4
Description
We apologize for the initial coverage deviation caused by converting the original figure into log-scale when submitting the final version of the paper. Taking min as the interval leads to the truncation of the initial stage of the curve, resulting in the misalignment of the starting points of V-shuttle-M and V-shuttle-S, and the initial coverage is inconsistent from the data in Table 2. Here, I replot a curve at more fine-grained second intervals to clarify our actual experimental data. Nevertheless, this mistake does not affect the experimental conclusion in our paper, and we just clarify this for those who want to reproduce our work. Thanks @cyruscyliu for pointing this out.
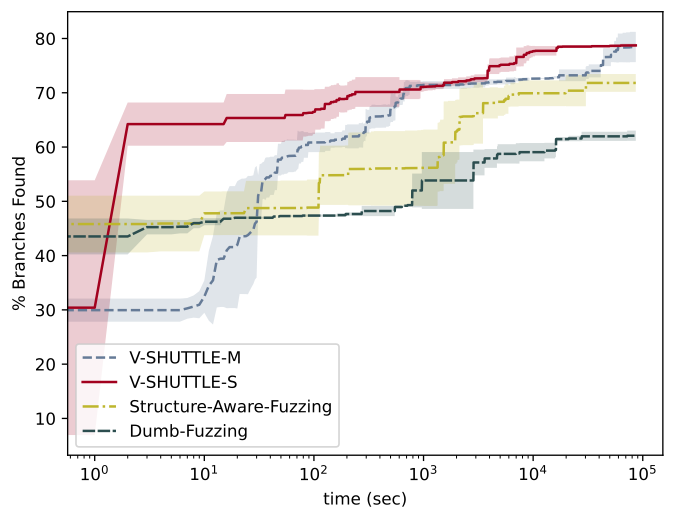
The original figure with log-scale is shown below.