系统弄得七七八八了,但是监控这一块还是比较空白的,前期只是简单用logstash收集处理一下,流程如下:
logback -> logstash -> 错误则发出告警 -> 存储到es
但这样操作不仅粒度太粗,而且无法监控主机的各项指标,比如有一台主机两次爆盘,我们浑然不知。
实际上以前公司都是基于Prometheus+Grafana+Zabbix来监控系统各项指标的,最近我们也准备来实践一下。本次实践分为以下几个部分:
1、部署Prometheus Operator
2、部署Kube-Prometheus
3、验证安装
4、添加相关性能指标Alert
5、集成钉钉/企业微信
1、部署Prometheus Operator
Prometheus Operator的社区相当活跃,版本迭代很快,为了保证操作的可用性,这次我们实践的版本0.22.1。
1.1、下载最新源码
git clone https://github.com/coreos/prometheus-operator.git
cd prometheus-operator
git checkout -b v0.22.1
为方便管理,创建一个单独的 Namespacemonitoring,后续Prometheus Operator 相关的组件都会部署到这个 Namespace。
kubectl create namespace monitoring
1.2 安装 Prometheus Operator Deployment
在安装之前,我们需要确保下面镜像能够正常被拉取,否则无法创建成功。所需镜像我们可以通过源码查看,也可以简单通过--dry-run --debug来查看生产的yaml文件(后续也是同样的操作)。
- quay.io/coreos/hyperkube:v1.7.6_coreos.0
- quay.io/coreos/prometheus-config-reloader:v0.20.0
- quay.io/coreos/configmap-reload:v0.0.1
- quay.io/coreos/prometheus-operator:v0.20.0
若是需要额外定制,请根据配置values.yaml进行定制。
镜像准备妥当,我们开始部署operator。
helm install --name prometheus-operator --namespace=monitoring helm/prometheus-operator --debug
部署时,最好打开debug模式,容易排查问题。
1.3、安装kube-prometheus
在0.2x以后,Prometheus、Grafana以及相关exporter统一打包成kube-prometheus,我们可以不用一一去安装配置他们。
同样地,确保下面镜像能够被正常拉取。
- quay.io/prometheus/prometheus:v2.2.1
- quay.io/prometheus/alertmanager:v0.14.0
- grafana/grafana:5.0.0
- quay.io/coreos/grafana-watcher:v0.0.8
- quay.io/prometheus/node-exporter:v0.15.2
- gcr.io/google_containers/kube-state-metrics:v1.2.0
- gcr.io/google_containers/addon-resizer:1.7
接着我们来定制属于自己的kube-prometheus。
1) 配置helm/kube-prometheus/requirements.yaml
首先,更新helm/kube-prometheus/requirements.yaml文件。
sed -i 's|    repository:|    #repository:|g' helm/kube-prometheus/requirements.yaml
sed -i 's|    #e2e-repository:|    repository:|g' helm/kube-prometheus/requirements.yaml
其次,定制一些参数,这里我们主要是替换掉gcr镜像。
sed -i 's|gcr.io/google_containers|anjia0532|g' helm/exporter-kube-state/values.yaml
sed -i 's|quay.io/prometheus|quay.io/prometheus|g' helm/kube-prometheus/values.yaml
这里之所以使用本地目录安装,主要出于两方面考虑:一方面是因为我司网络不稳定,另一方面方便我们做一些定制。
2) 配置helm/alertmanager
sed -i 's|type: ClusterIP|type: NodePort|g' helm/alertmanager/values.yaml
3) 配置helm/grafana
sed -i 's|type: ClusterIP|type: NodePort|g' helm/grafana/values.yaml
sed -i 's|enabled: "true"|enabled: "false"|g' helm/grafana/values.yaml

sed -i '42 a- name: GF_AUTH_BASIC_ENABLED' helm/grafana/values.yaml
sed -i '43 a\  value: false' helm/grafana/values.yamlsed -i '38 a- name: GF_DATABASE_TYPE' helm/grafana/values.yaml
sed -i '39 a\  value: mysql' helm/grafana/values.yaml
sed -i '40 a- name: GF_DATABASE_URL' helm/grafana/values.yaml
sed -i '41 a\  value: mysql://grafana:123456@192.168.64.168:3306/grafana' helm/grafana/values.yaml
sed -i '42 a- name: GF_DATABASE_SSL_MODE' helm/grafana/values.yaml
sed -i '43 a\  value: disable' helm/grafana/values.yaml
这里使用到mysql存储grafana数据,请提前准备好mysql数据库。mysql数据持久化配置请参考http://docs.grafana.org/installation/configuration/
另外,我们也可以指定自己的grafana配置文件,但是遗憾的是不支持configmap的配置,这里就不展开说明。
4) 配置helm/kube-prometheus/values.yaml
sed -i 's|type: ClusterIP|type: NodePort|g' helm/kube-prometheus/values.yaml
5) 更新依赖
使用命令将本地的charts打包到helm/kube-prometheus/charts目录下
[root@passport-dev prometheus-operator]# helm dep up helm/kube-prometheus
Hang tight while we grab the latest from your chart repositories...
...Unable to get an update from the "local" chart repository (http://127.0.0.1:8879/charts):
	Get http://127.0.0.1:8879/charts/index.yaml: dial tcp 127.0.0.1:8879: connect: connection refused
...Successfully got an update from the "incubator" chart repository
...Successfully got an update from the "stable" chart repository
...Successfully got an update from the "coreos-charts" chart repository
Update Complete. ⎈Happy Helming!⎈
Saving 12 charts
Deleting outdated charts
6) 安装kube-prometheus
helm install --name kube-prometheus \
--debug \
--namespace=monitoring helm/kube-prometheus
可以使用--dry-run看下各个配置是否是预期的。
这里需要说明的是,
- 如果你以后Grafana,请设置deployGrafana: false,然后再单独配置Prometheus的DataSource
- 如果使用代理时,设置prometheus.routePrefix是非常有用的
- 默认情况下,Prometheus使用的端口是30900grafana使用的是30902,AlertManager使用的是30903。
当然我们也可以逐个安装exporter-xxxx,但是为了方便管理我们还是统一使用kube-prometheus来进行安装。
至此,kubernetes+grafana以及部署完毕,接下来我们就来验证一下是否安装正常。
3、验证安装
[root@passport-dev prometheus-operator]# helm list
NAME               	REVISION	UPDATED                 	STATUS  	CHART                     	NAMESPACE
kube-prometheus    	1       	Mon Jul 30 21:49:40 2018	DEPLOYED	kube-prometheus-0.0.95    	monitoring
prometheus-operator	1       	Mon Jul 30 21:40:02 2018	DEPLOYED	prometheus-operator-0.0.27	monitoring
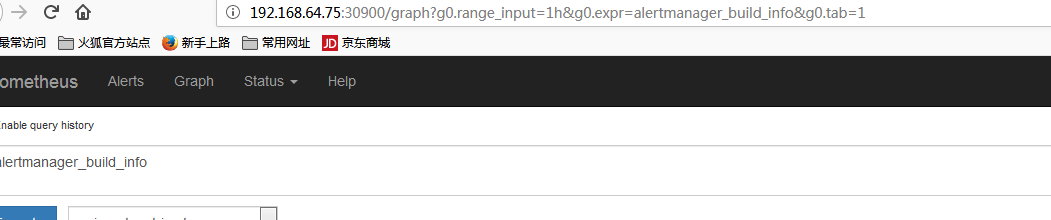
通过地址http://192.168.64.75:30900访问Prometheus
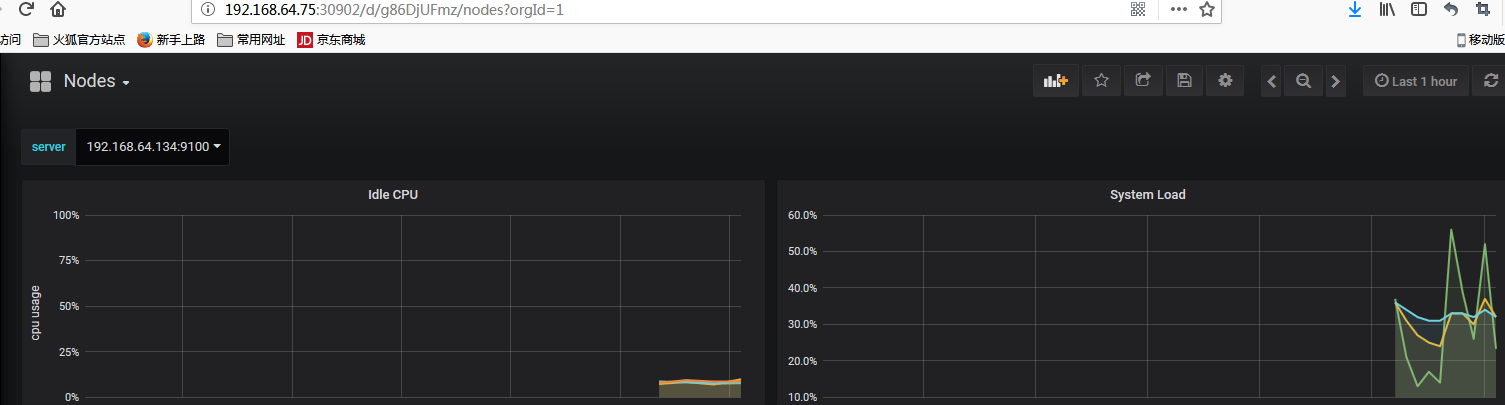
通过地址http://192.168.64.75:30902/?orgId=1访问grafana
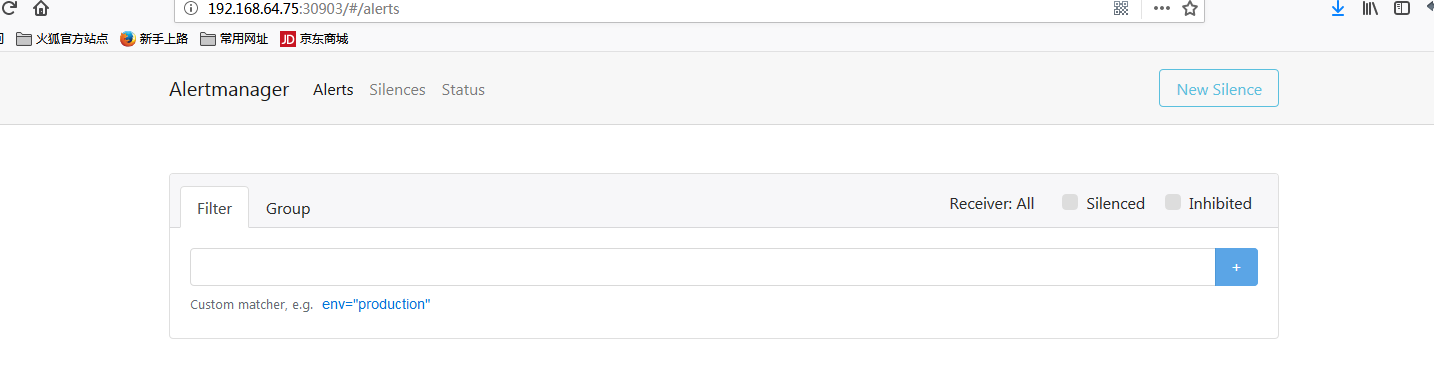
通过地址http://192.168.64.75:30903访问alertmanager
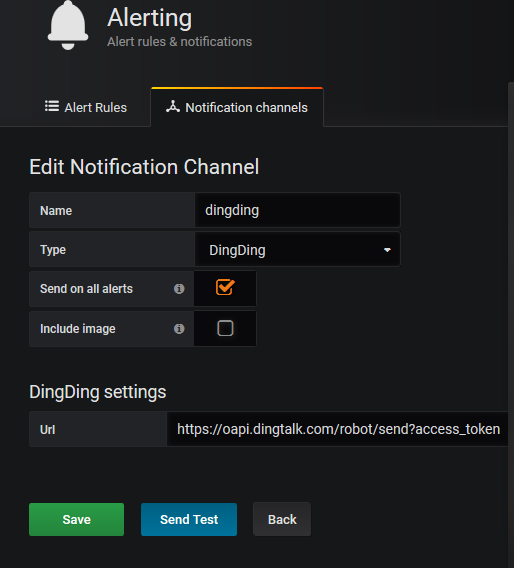
4、集成钉钉
点击 alerting —> notifications,添加通知媒介,这里我们选择钉钉来进行集成。
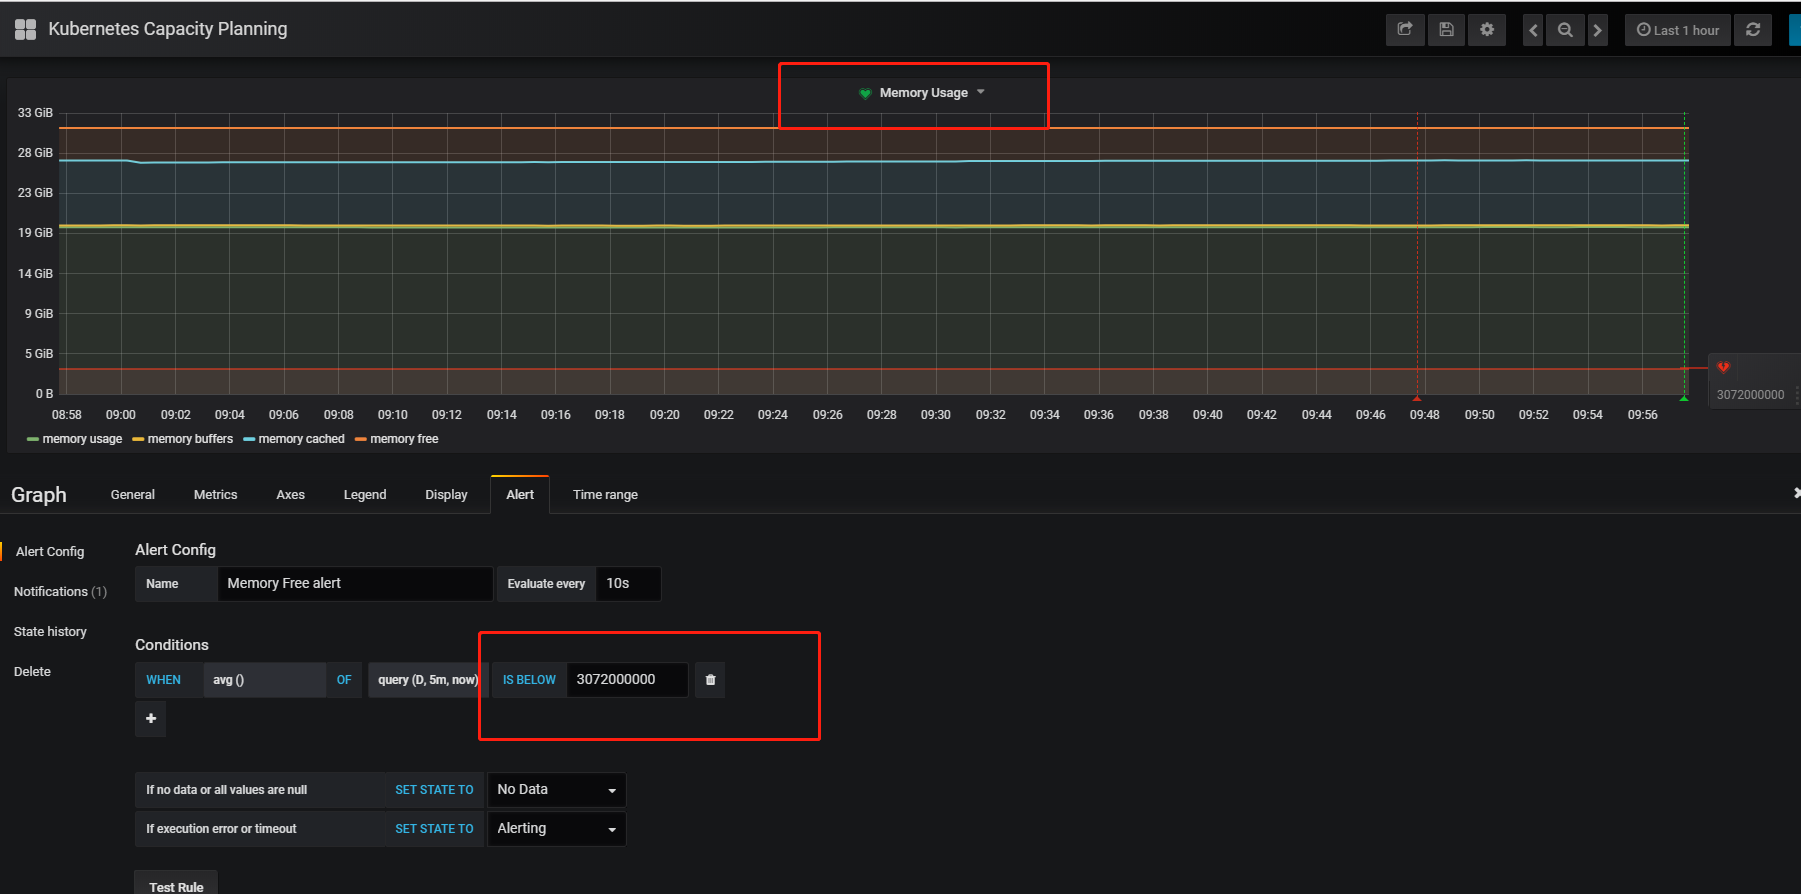
5、添加相关性能指标Alert
1)打开Kubernetes Capacity Planning下的Metrics Tab查询,查看是否有满足要求的查询条件,没的话可以自己新增。
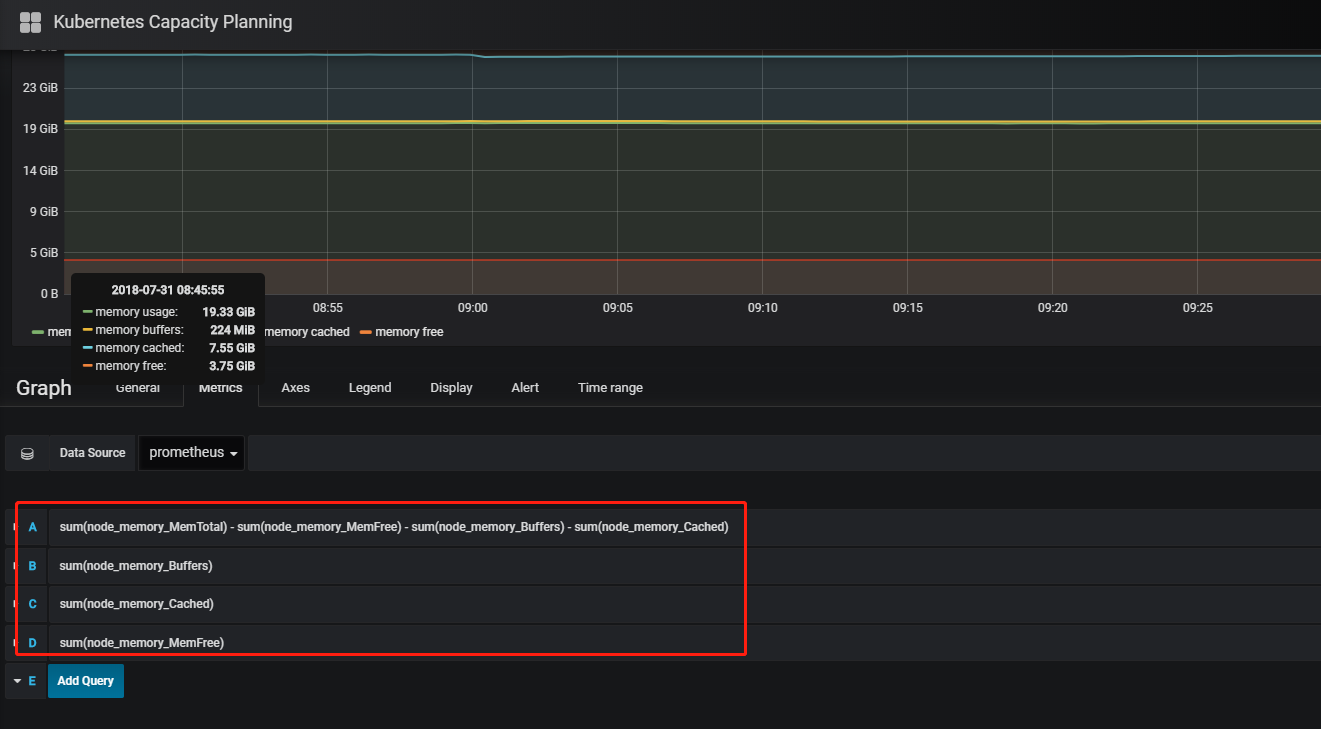
需要注意的是Query里面不能有参数,否则会报错误Template variables are not supported in alert queries 。
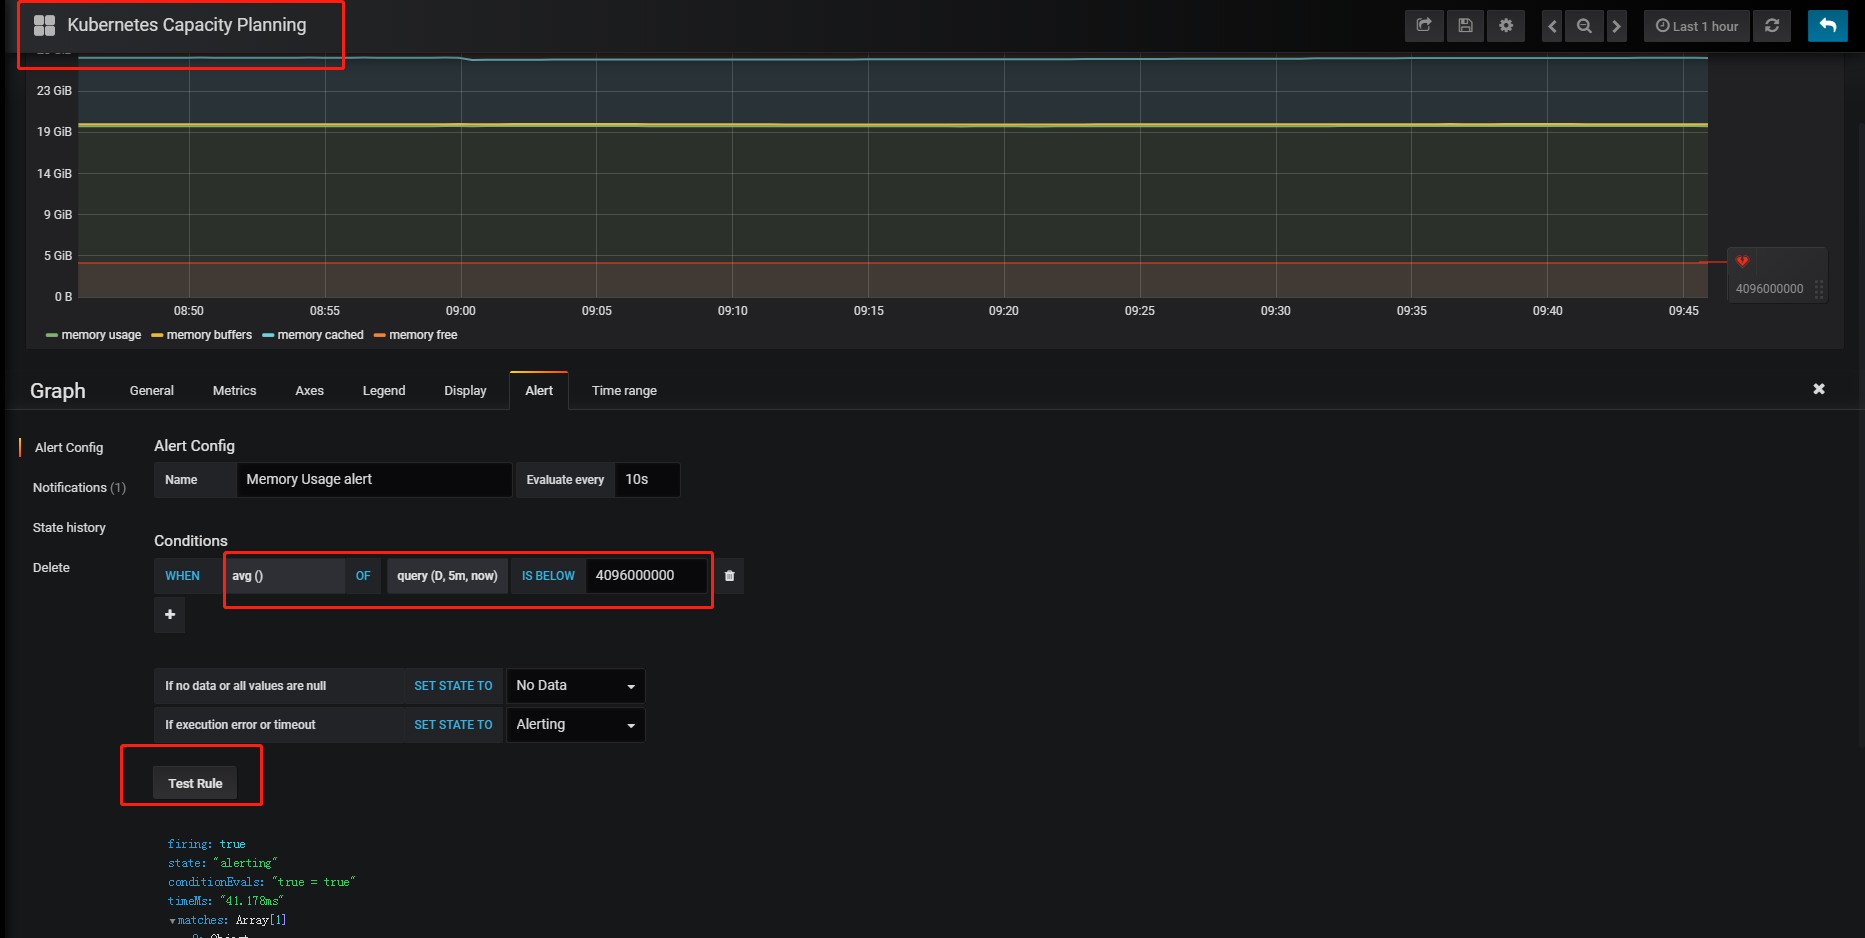
2)打开Alert Tab,新增监控指标,这里选择监控metrics的查询D,然后点击Test Rule看下是否正常。
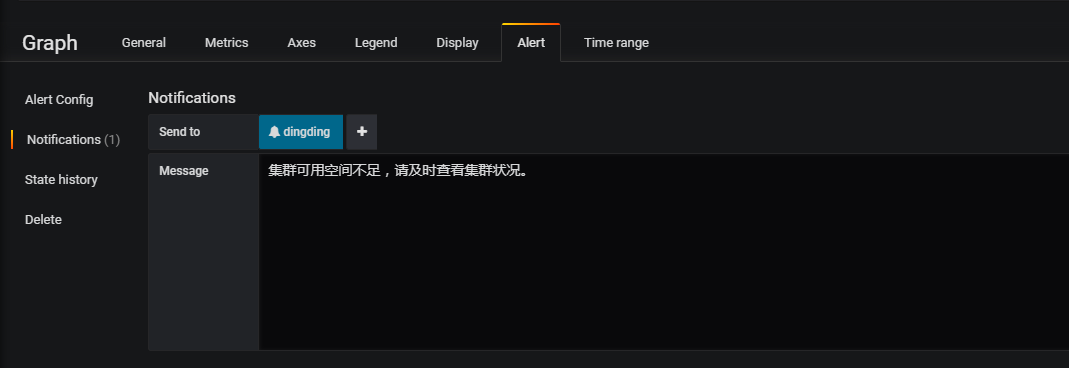
3)点击Notifications配置通知渠道,然后保存,名字不用填。
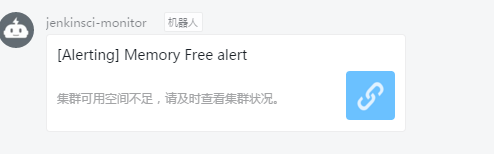
4)很快钉钉就收到内存低于4G的报警
5)修改指标,发现很快收到异常恢复的通知

发现图标上面的小红心也变成了绿色
问题排查
1、kubelet监控异常,状态down
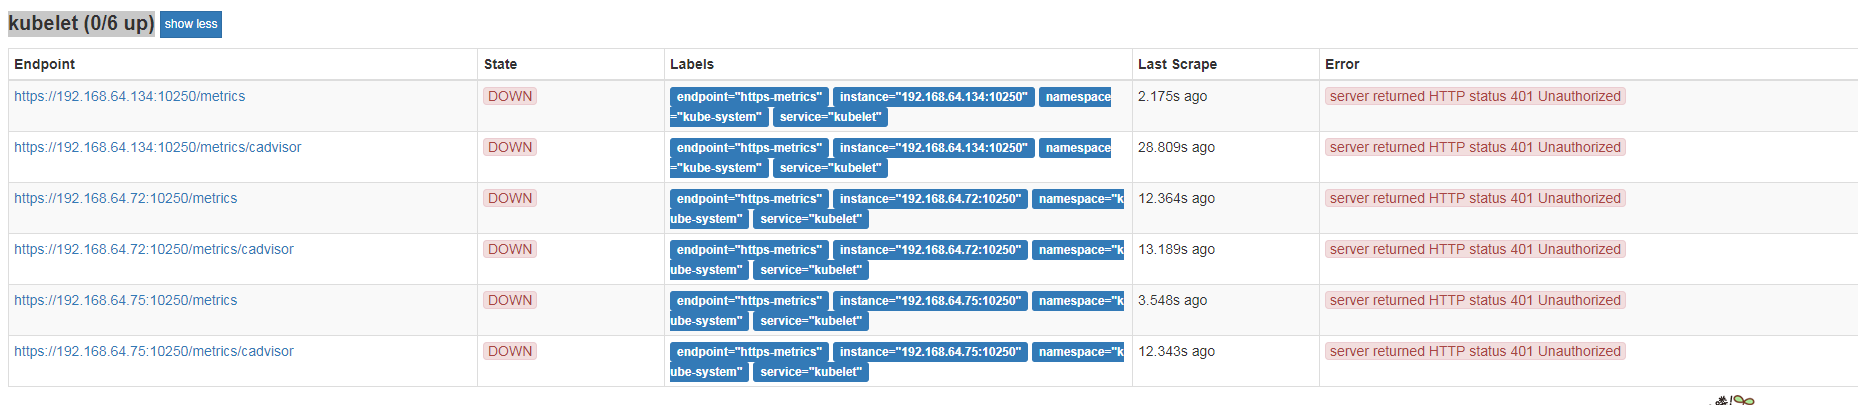
这个问题比较简单,访问kubelet的api时验证异常,关于kubelet有几个知识点需要我们了解一下。
- use 10255 insecure (http) read only port
- use 10250 secure (https) port with client certs
- use 10250 secure (https) port with service account token authentication
知道了问题所在,那么解决办法也是有的:
- 使用http代替https
- 配置Kubelet的ServiceMonitor,引入k8s的ca证书
这里我们直接使用http来访问kubelet的统计信息。
[root@passport-dev prometheus-operator]# kubectl -n monitoring get servicemonitor kube-prometheus-exporter-kubelets -o yaml | sed 's/https/http/' | kubectl replace -f -
servicemonitor "kube-prometheus-exporter-kubelets" replaced
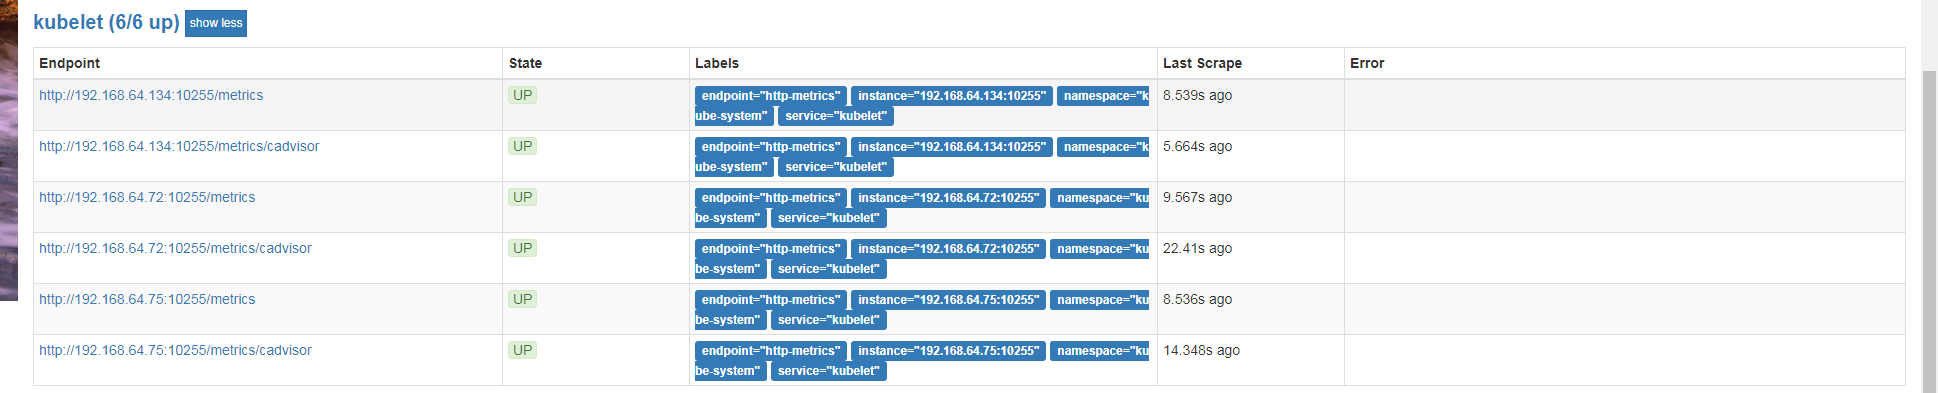
发现Targets状态变成了UP。
2、Grafana的地址异常
通过钉钉打开告警信息,发现打开的地址是http://localhost:3000//d/tZeDCUKiz/kubernetes-capacity-planning?fullscreen=true&edit=true&tab=alert&panelId=4&orgId=1,之所以是localhost,就是我们没有配置Grafana的server信息。
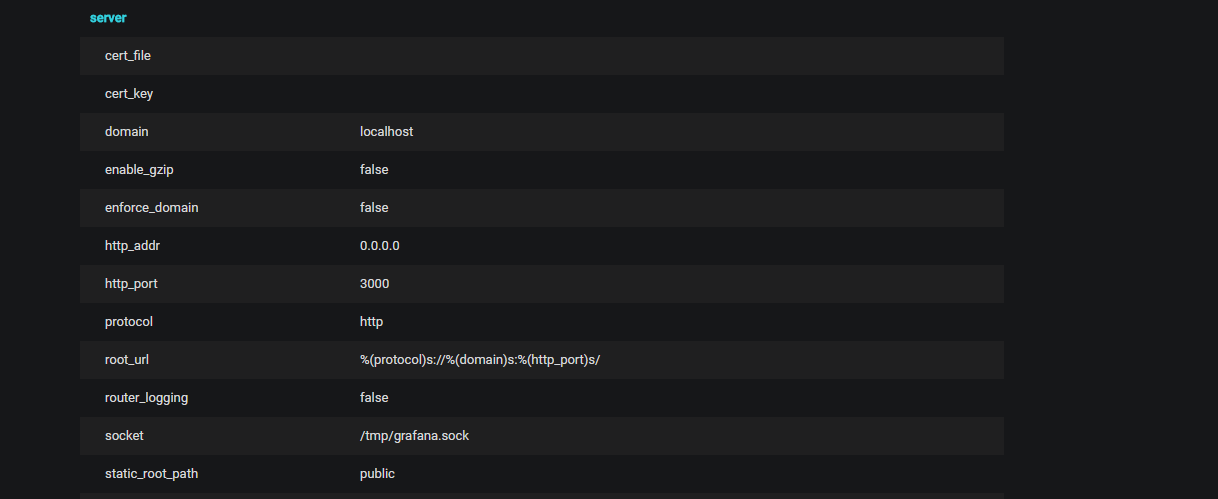
[root@passport-dev prometheus-operator]# kubectl -n monitoring get deployment kube-prometheus-grafana -o yaml | sed '/name: GF_AUTH_BASIC_ENABLED/i\        - name: GF_SERVER_ROOT_URL\n\          value: "http://192.168.64.75:30902"' | kubectl apply -f -
deployment "kube-prometheus-grafana" replaced
注意这里IP端口是假设提前知道的,最好的情况是我们在安装的时候就创建ingress绑定域名。
后续
接下来我们就可以创建自己的ServiceMonitor来监控相关服务。
系统弄得七七八八了,但是监控这一块还是比较空白的,前期只是简单用logstash收集处理一下,流程如下:
但这样操作不仅粒度太粗,而且无法监控主机的各项指标,比如有一台主机两次爆盘,我们浑然不知。
实际上以前公司都是基于Prometheus+Grafana+Zabbix来监控系统各项指标的,最近我们也准备来实践一下。本次实践分为以下几个部分:
1、部署Prometheus Operator
2、部署Kube-Prometheus
3、验证安装
4、添加相关性能指标Alert
5、集成钉钉/企业微信
1、部署Prometheus Operator
Prometheus Operator的社区相当活跃,版本迭代很快,为了保证操作的可用性,这次我们实践的版本0.22.1。
1.1、下载最新源码
为方便管理,创建一个单独的 Namespace
monitoring,后续Prometheus Operator 相关的组件都会部署到这个 Namespace。1.2 安装 Prometheus Operator Deployment
在安装之前,我们需要确保下面镜像能够正常被拉取,否则无法创建成功。所需镜像我们可以通过源码查看,也可以简单通过
--dry-run --debug来查看生产的yaml文件(后续也是同样的操作)。镜像准备妥当,我们开始部署operator。
1.3、安装kube-prometheus
在0.2x以后,Prometheus、Grafana以及相关exporter统一打包成
kube-prometheus,我们可以不用一一去安装配置他们。同样地,确保下面镜像能够被正常拉取。
接着我们来定制属于自己的kube-prometheus。
1) 配置
helm/kube-prometheus/requirements.yaml首先,更新helm/kube-prometheus/requirements.yaml文件。
其次,定制一些参数,这里我们主要是替换掉gcr镜像。
2) 配置
helm/alertmanager3) 配置
helm/grafana另外,我们也可以指定自己的grafana配置文件,但是遗憾的是不支持configmap的配置,这里就不展开说明。
4) 配置
helm/kube-prometheus/values.yaml5) 更新依赖
使用命令将本地的charts打包到
helm/kube-prometheus/charts目录下6) 安装kube-prometheus
这里需要说明的是,
至此,kubernetes+grafana以及部署完毕,接下来我们就来验证一下是否安装正常。
3、验证安装
通过地址


http://192.168.64.75:30900访问Prometheus通过地址
http://192.168.64.75:30902/?orgId=1访问grafana通过地址
http://192.168.64.75:30903访问alertmanager4、集成钉钉

点击 alerting —> notifications,添加通知媒介,这里我们选择钉钉来进行集成。
5、添加相关性能指标Alert
1)打开

Kubernetes Capacity Planning下的Metrics Tab查询,查看是否有满足要求的查询条件,没的话可以自己新增。2)打开Alert Tab,新增监控指标,这里选择监控metrics的查询D,然后点击

Test Rule看下是否正常。3)点击

Notifications配置通知渠道,然后保存,名字不用填。4)很快钉钉就收到内存低于4G的报警

5)修改指标,发现很快收到异常恢复的通知


问题排查
1、kubelet监控异常,状态down

这个问题比较简单,访问kubelet的api时验证异常,关于kubelet有几个知识点需要我们了解一下。
知道了问题所在,那么解决办法也是有的:
这里我们直接使用http来访问kubelet的统计信息。
发现Targets状态变成了UP。
2、Grafana的地址异常

通过钉钉打开告警信息,发现打开的地址是
http://localhost:3000//d/tZeDCUKiz/kubernetes-capacity-planning?fullscreen=true&edit=true&tab=alert&panelId=4&orgId=1,之所以是localhost,就是我们没有配置Grafana的server信息。后续
接下来我们就可以创建自己的ServiceMonitor来监控相关服务。