A Trajectory Analytics and Visualization tool for drones' trajectory reconstruction, enrichment and semantic annotation based on MovingPandas
You can run the notebook on MyBinder - no installation required:
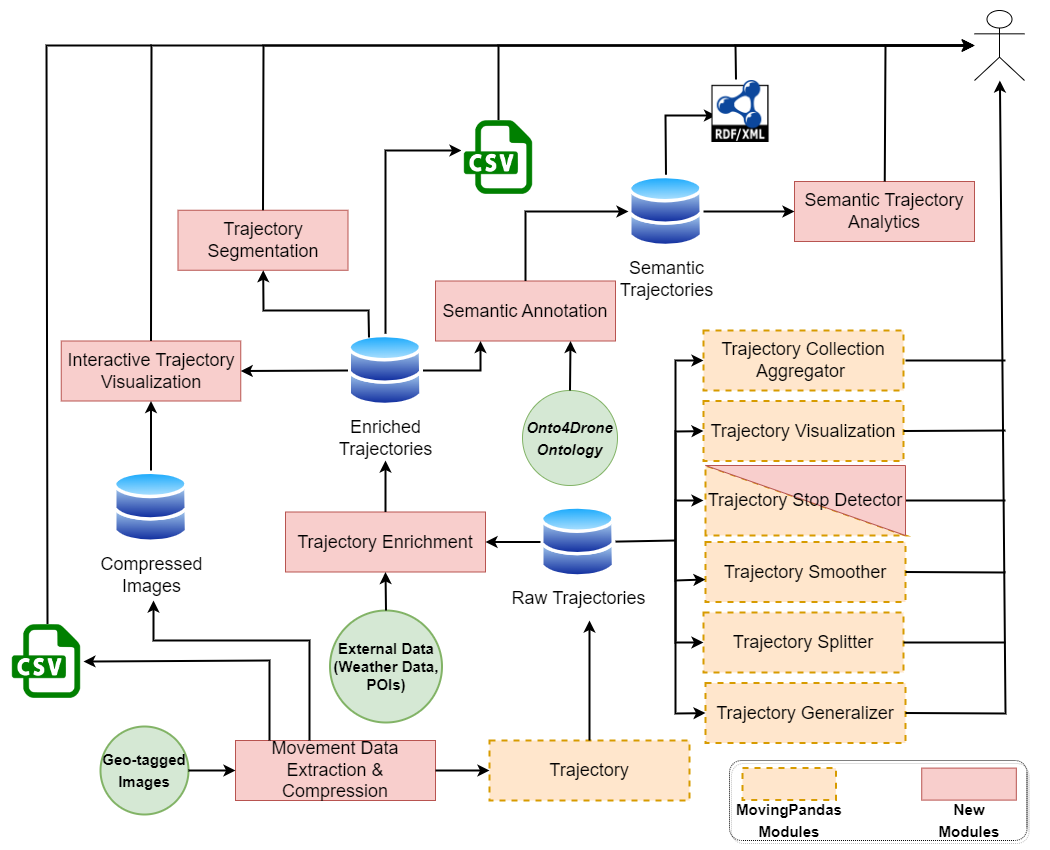
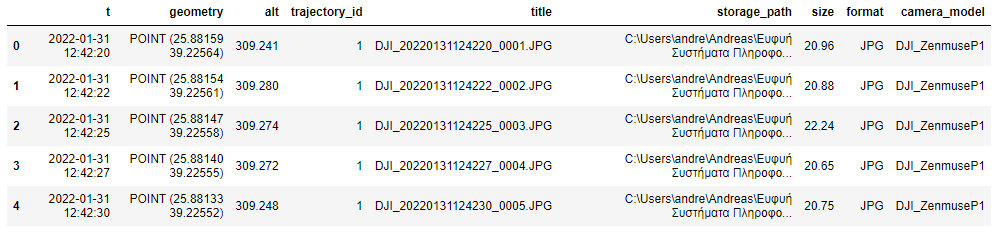
The ReconTraj4Drones framework takes a set of geo-tagged photos (taken by drones during its mission) as input to reconstruct the drone's (raw) trajectory. The term raw is referred to a trajectory with only spatial and temporal information (latitude, longitude, timestamp). In this phase of trajectory analysis, we can use the functionality provided by MovingPandas, such as Trajectory Smother, Trajectory Splitter, etc. It is important to note that each geo-tagged image is a recording point in the trajectory.
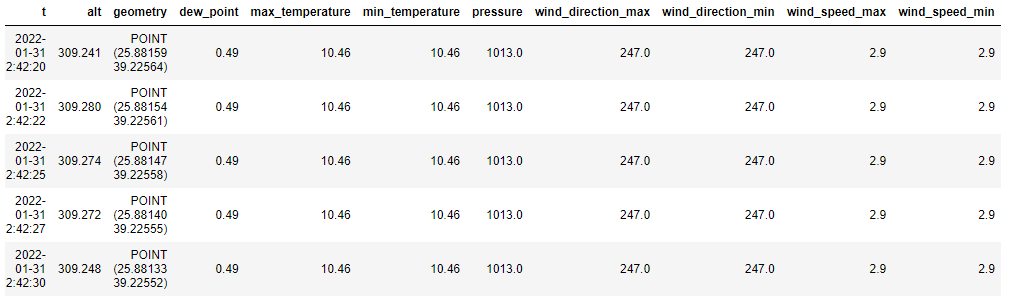
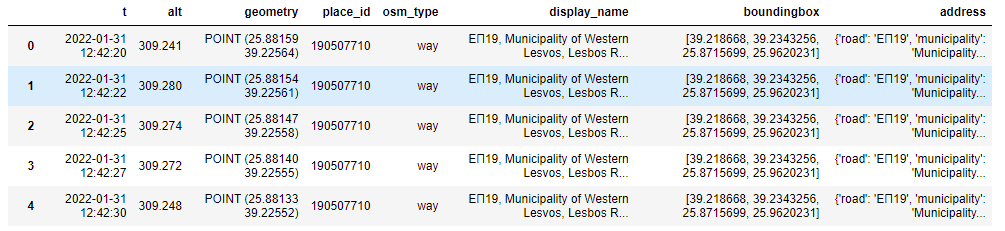
The reconstructed raw trajectory can be enriched with external heterogeneous information regarding weather conditions and Points of Interest (POIs) creating the enriched trajectories. The weather data are fetched using external free web services (Meteostat and OpenWeather). For the latter, registration and a private API key are required. The data concerning the POIs are fetched by OpenStreetMap.
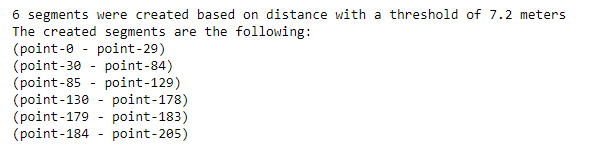
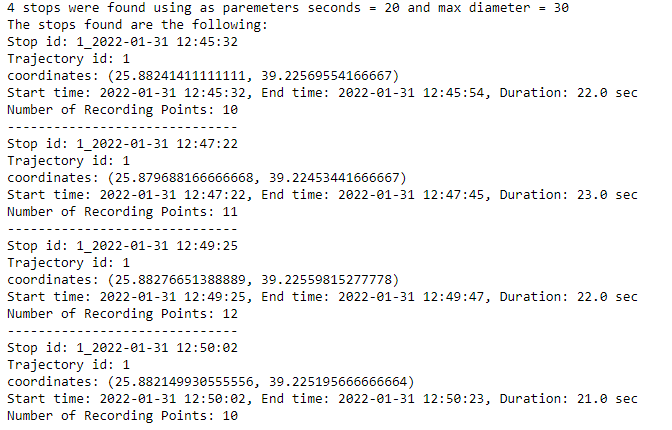
The enriched trajectory can be enriched using various criteria such as altitude variation, distance, and time interval between consecutive points (images). The criterion along with the threshold is determined by the user. Moreover, by extending the functionality provided by MovingPandas, the user can detect stops in the trajectory. The user determines the stop duration in seconds and the maximum diameter. The framework returns the number of stops along with the number of recording points (geo-tagged images) included in each stop.
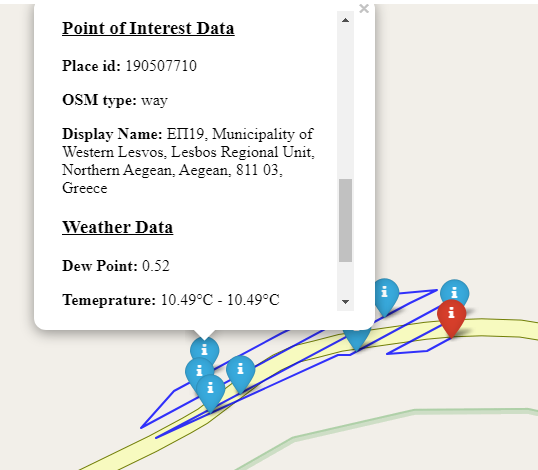
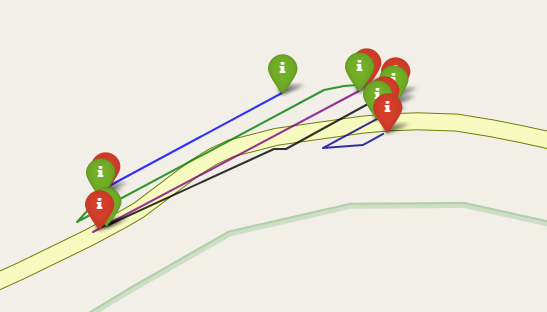
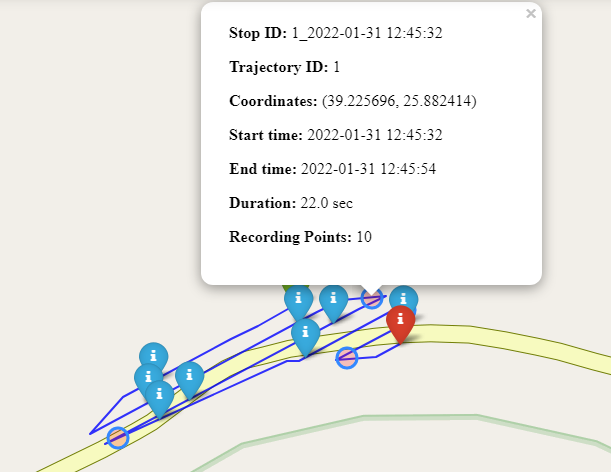
Interactive visualization of trajectories enables the users to visualize the enriched trajectories. The framework not only depicts the trajectory itself but also visualizes the recording points, which makes them clickable. Thus, the user can click on them and see the related data about that point, such as latitude, longitude, timestamp, the geo-tagged image, weather conditions, and POIs. The user can determine the portion of the recording points to be displayed in the trajectory. Moreover, the first and the last point of the trajectory are always displayed with different colors (green for the starting point and red for the ending point) to depict the start and the end of the trajectory. The trajectory segments can also be displayed. In this case, each segment is displayed with a different color, while the starting and the ending points are also displayed to determine the boundaries of the segment. Last but not least, the detected stops can also be displayed as clickable circles of red color. Clicking these circles, the user can see the details about the stop like start time, end time, duration, number of recording points, etc.
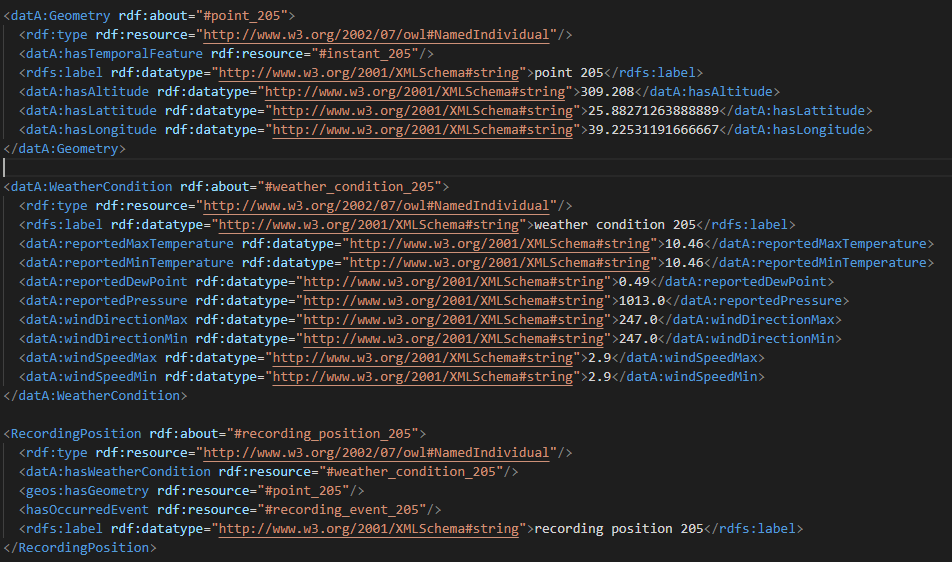
To ensure a high-level formalism we use the ontological approach. Particularly, we use the Onto4Drone ontology (https://github.com/KotisK/onto4drone) which has been developed in our laboratory. To incorporate ontologies and work with RDF we use the owlready2 library of python. The exported data in RDF format can be used for further analysis in third-party software like Protege. However, the ReconTraj4Drones framework enables the user to execute Semantic Trajectory Analytics using SPARQL queries. This functionality is provided by the owlready2 library as well.
Soularidis, A., Kotis, K. (2022). Semantic Modeling and Reconstruction of Drones’ Trajectories. In: , et al. The Semantic Web: ESWC 2022 Satellite Events. ESWC 2022. Lecture Notes in Computer Science, vol 13384. Springer, Cham. https://doi.org/10.1007/978-3-031-11609-4_30
Kotis, K.; Soularidis, A. ReconTraj4Drones: A Framework for the Reconstruction and Semantic Modeling of UAVs’ Trajectories on MovingPandas. Appl. Sci. 2023, 13, 670. https://doi.org/10.3390/app13010670