Home

Welcome to the HantaNet wiki! HantaNet is a standalone Hantavirus data visualization engine, powered by MicrobeTrace. This site shows you a specific use-case scenario for MicrobeTrace, which is a free, secure web-browser based visualization tool that facilitates the integration and analysis of laboratory, epidemiological and genetic data.
Hantaviruses are RNA viruses with a segmented genome that are shed via urine, feces, and saliva from an infected animal host and spread to people via aerosolized virus-containing particles. Each hantavirus strain is predominantly associated with one rodent species or few closely related species. Hantavirus Pulmonary Syndrome (HPS) is a respiratory disease caused by "New World" hantaviruses (e.g. Sin Nombre Virus) and Hemorrhagic Fever with Renal Syndrome (HFRS) is caused by "Old World" hantaviruses (e.g. Seoul Virus). Studies have shown that "New World" and "Old World" hantaviruses are phylogenetically distinct.
Please check out our publication titled HantaNet: A New MicrobeTrace Application for Hantavirus Classification, Genomic Surveillance, Epidemiology and Outbreak Investigations. We also have a HantaNet Tool Demonstration Video available.
Scope: Web platform for hantavirus data submission, analysis and visualization to improve domestic hantavirus surveillance, standardize and modernize diagnostics, case reporting and data sharing between the CDC and academic institutions, state and public health labs.
HantaNet features:
- Pre-loaded sequence reference sets for each segment (Small, Medium and Large)
- Open-reading frame; stop codon removed
- Collection dates of reference sequences: 1982-2017
- Datasets contain viral sequences of animal and human origin; updated regularly
What you can do:
- Subtype and classify your hantavirus sequences
- Network or phylogenetic tree visualization of your data
- Overlay molecular and epidemiological links
- Visualize spatiotemporal distribution of hantaviruses
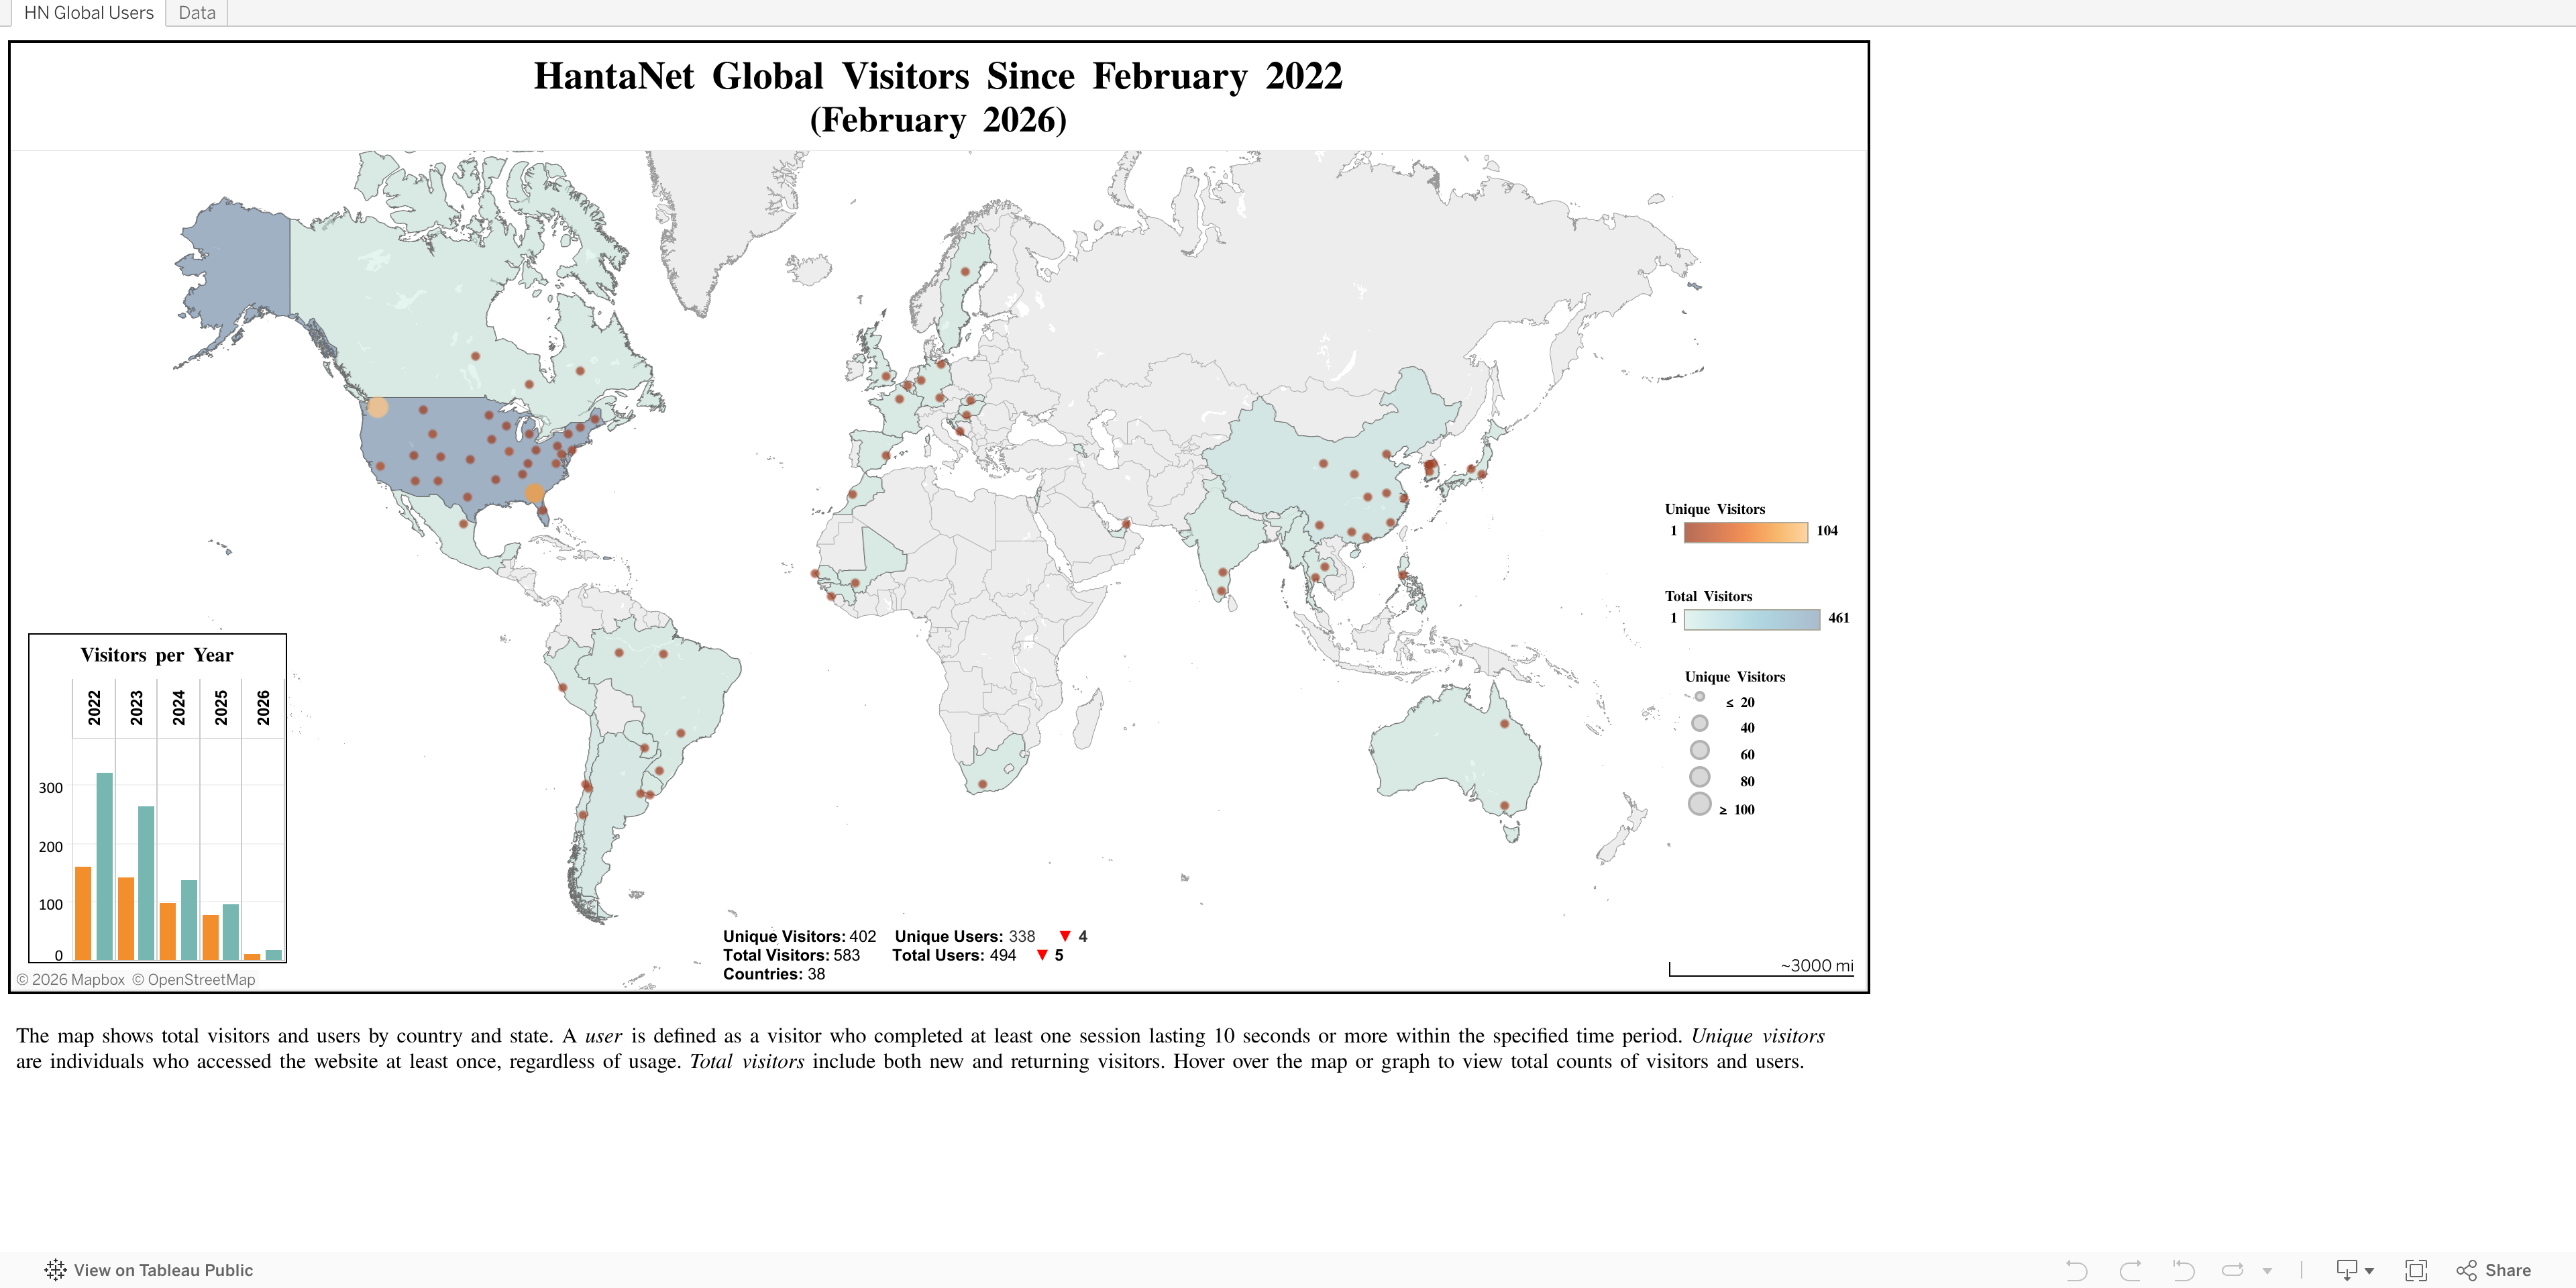
As of February 2026, HantaNet has about 400 visitors, including over 300 users, and has accumulated more than 500 total site visits. The bar chart shows annual visitor counts from 2022 through 2026. Click the image to open the published dashboard in Tableau Public and explore total counts of visitors and users.
HantaNet Project Contacts: Roxana Cintron (vrw7@dc.gov), Shannon Whitmer (evk3@cdc.gov), Joel Montgomery (ztq9@cdc.gov), Bill Switzer (bis3@cdc.gov)