Module Dataset Explorer
Here we describe the Dataset Explorer module through the use cases it supports, including:
- Building an annotation-ready dataset and exporting it to an excel file.
- Determining dataset instances that require further annotations (e.g., those annotated by a single annotator or where there is no consensus for the final label).
- Exporting an annotated dataset to excel files.
- Calculating annotation consistency regarding code metrics for one or multiple annotators.
The module works with the dataset entity, whose class diagram is given below.

The DataSet contains DataSetInstances that map to a specific code snippet (class or function). Each instance contains a code link (the URL of the repository and the location of the particular code snippet, including start and end line of code). It also contains the metrics of the code snippet, defined in our Code Model.
Each instance can have one or mote DataSetAnnotations that represent the annotators opinion if the code snippet is affected by some CodeSmell, what the severity of the smell is, and which SmellHeuristics helped the annotator make this annotation.
Datasets provide the basis for developing machine learning models. For code quality assessment, datasets include code snippets that have been annotated for the presence and severity of code smells or other quality issues. For example, we might label that a class suffers from the Large Class code smell with a severity of 3, signaling that the class is a god class.
The Dataset Explorer enables configurable building of a dataset that is ready for labeling from one or more code repositories. The main success scenario has the following steps:
- The researcher defines one or more URLs that point to code repositories. This can either be a location on the local disk, or a link to a repository hosting service, such as GitHub.
- The Dataset Explorer invokes the Code Model module, which processes the code to create a CaDET model of the project.
- The researcher defines a filtering strategy either for each CaDET project or for all of them. The filtering strategy defines the criteria for excluding certain code snippets. Examples include excluding object constructor functions, functions with less than 5 lines of code, or classes with less than 4 fields.
- The Dataset Explorer applies the filtering strategy and constructs the annotation-ready dataset.
- The researcher supplies the code quality issues they would like to annotate, along with any heuristics that decompose this issue. We further describe our smells and heuristics model in our Glossary.
- The researcher selects the format for exporting the dataset. Currently only excel is supported.
- The Dataset Explorer builds the template based on the heuristic model and populates it with instances from the dataset, delivering the output to the researcher.
The following figure illustrates an output of the described use case. Each code smell is represented by a single tab, where the heuristic columns are defined based on the heuristics model. The rows are populated from the prepared dataset, where each row is an instance from a project.

The result of the previous use case of building dataset is the created dataset. Annotators go through the initial annotation phase in which they populate severity and heuristics for dataset instances. This phase transforms the dataset to the draft state.
After an initial annotation phase, the Platform determines whether dataset instances require additional annotations. The Platform will require additional annotations when:
- Only one annotator annotated dataset instance - The Platform will find insufficiently annotated instances, after which the annotators need to perform additional annotation of these instances.
- No consensus in the annotations for the final label (all annotators gave different labels) - Researchers discuss instances for which no agreement has been achieved and change the annotations to reach the missing consensus.
The following figure illustrates the described life cycle of the dataset.

The Platform uses the MANOVA and ANOVA tests to calculate the annotation consistency.
The ANOVA test (Analysis of Variance) is a statistical method for determining a difference between two or more groups. Groups refer to different groups within the same independent variable. The null hypothesis of ANOVA is that there is no difference among group means. The alternate hypothesis is that at least one group differs significantly from the overall mean of the dependent variable. Only one dependent variable is used in the ANOVA test.
The MANOVA test (Multivariate Analysis of Variance) extends the ANOVA test and allows a combination of dependent variables to be considered instead of one. The null hypothesis and the alternate hypothesis are the same as in the ANOVA test, except a combination of dependent variables is considered rather than one.
For the test results interpretation, it is necessary to analyze the p-value, which represents the probability - the higher value provides stronger proof of the hypothesis (hypothesis: there is no statistically significant difference between the mean values). Researchers should compare p-value with the significance level α, which usually has a value of 0.05 (this value indicates a 5% risk that there is no relationship between dependent and independent variables).
Interpretation of the results:
- P-value ≤ α: If the p-value is less than or equal to the significance level, researchers can conclude that the differences in mean values are statistically significant.
- P-value ≥ α: If the p-value is greater than or equal to the significance level, researchers cannot conclude that the differences in mean values are statistically significant.
The following figure illustrates the described use case: Annotated data is prepared and sent for testing. The researchers interpret the test results according to the guidelines given above.

Goal: To conclude whether the annotations of one annotator differ in terms of metrics. More precisely, whether the values of the metrics affected the assigned annotation and whether the annotator was consistent when annotating (whether similar instances were marked with the same annotation).
The MANOVA test is executed for each annotator separately and each code smell separately. It is possible to run the test on one or more annotated projects.
The data preparation involves separating annotated instances into groups (e.g., if the annotators have four levels of severity, then all annotations are split into four groups). The annotation (severity) is an independent variable, and the metrics are dependent variables. The following figure illustrates prepared data.

Goal: To conclude whether the annotations of one annotator differ in terms of metric values - whether the metric values of the instances annotated by the same annotation are similar.
The Platform executes the ANOVA test to determine the significance of the metrics concerning the assigned annotations. Data preparation is the same as in checking the consistency for one annotator, but the test is performed for each metric separately.
Goal: To conclude whether the annotated instances differ in metrics'values for a particular severity - whether different annotators have assigned the same severity to similar instances.
The MANOVA test is executed for each severity separately and each code smell separately. It is possible to run the test on one or more annotated projects.
The data preparation involves separating annotated instances into groups (a group for each annotator). The annotator is an independent variable, and the metrics are dependent variables.
Goal: To determine which metrics violate the consistency of the annotations between annotators.
The Platform executes the ANOVA test to determine the significance of the metrics concerning the assigned annotations. Data preparation is the same as in checking the consistency between annotators, but the test is performed for each metric separately.
The DataSet Explorer console application should allow the user to quickly and easily use all the features provided by the module. The console application has four main functionalities that match the use cases of the module, and these are available in the main menu (shown in the figure below):

Suppose a user chooses to create a dataset. In that case, it is necessary to enter the data set name, the path to the folder where the generated dataset will be saved and the path to the file containing projects information (.csv file containing data for one or more projects in the form of (A) project name and (B) project URL on Github). The following illustrations show this use case and an example of a .csv projects file.


For the second use case (dataset analysis), the user should enter the path to the file containing projects information (.csv file containing data for one or more projects in the form of (A) the path of the folder where the annotated dataset is located and (B) the path to the folder where the analysis results will be saved). The user can choose one of two options - finding instances that require additional annotation or instances with all disagreeing annotations. This use case and .csv projects file are shown in the figure below.


Regarding the third use case, the user should specify the paths to the .csv files with projects and annotators' information and the path to the folder where the dataset will be exported. Examples of these files are shown below. For projects, it is necessary to specify (A) the path to the local repository and (B) the path to the folder with annotations for a given project. For annotators, it is necessary to provide (A) id, (B) years of experience, and (C) ranking.


For the fourth use case, the user enters the paths to the .csv files with projects and annotators (as in the third use case). After selecting one of the four offered options, the user should also enter the id of the specific annotator or the severity value to perform the analysis.

The DataSet Explorer web application should allow a group of annotators to quickly and easily use the following functionalities:
- Building an annotation-ready dataset.
The user creates an empty dataset, specifying the name and the code smells that will be annotated within this set.
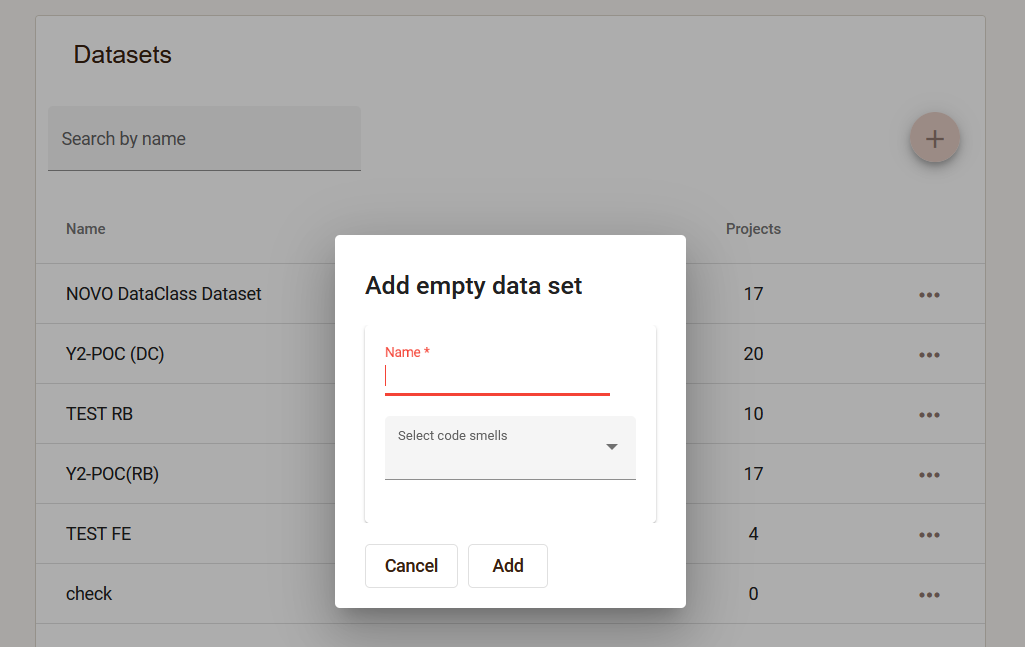
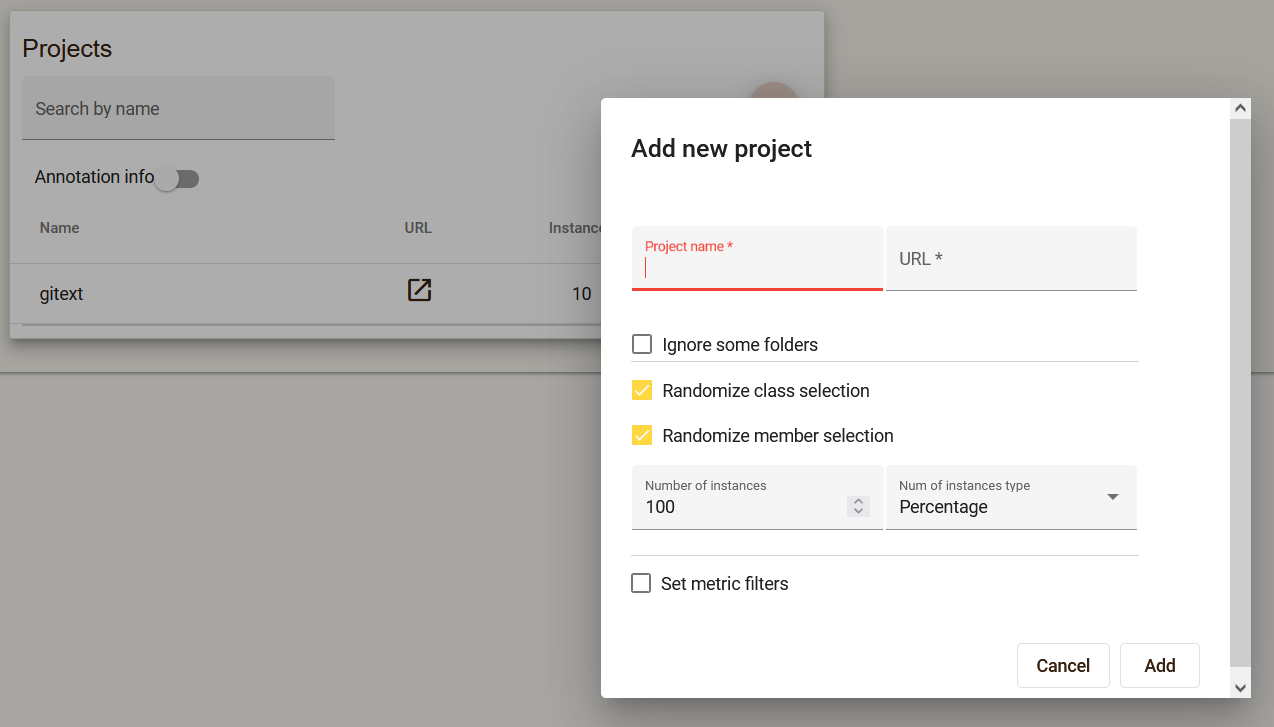
Multiple projects can be added within one dataset, providing a link to the Github repository. It is possible to set filters that will limit the number and type of instances that will be in the project.
-
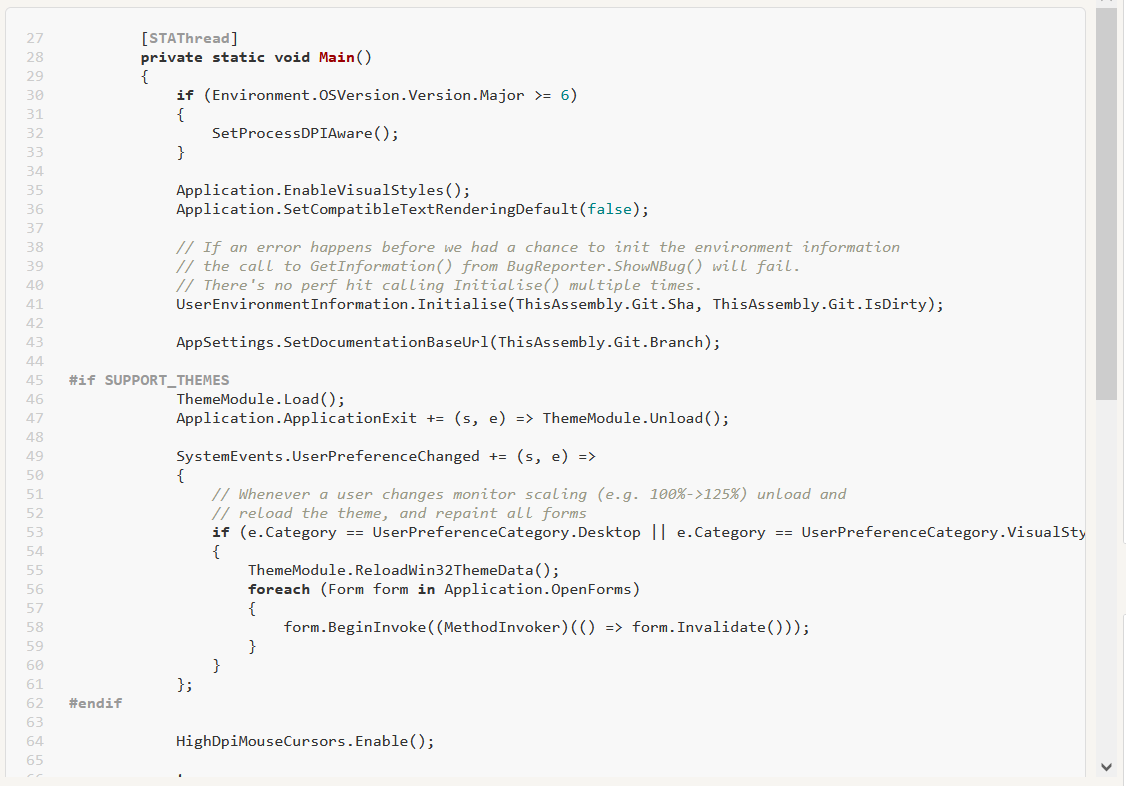
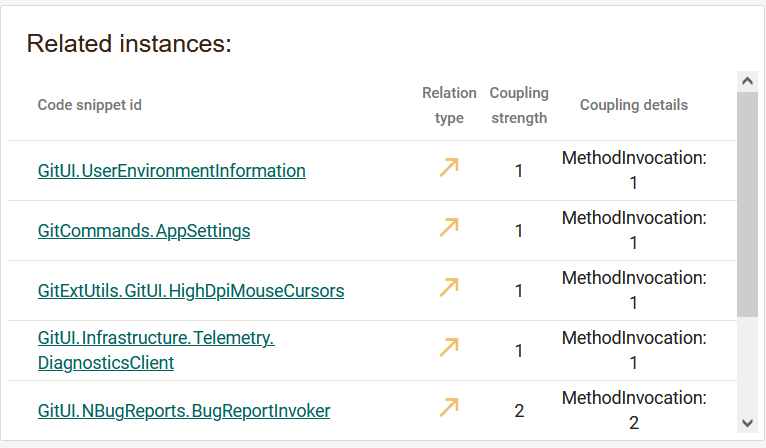
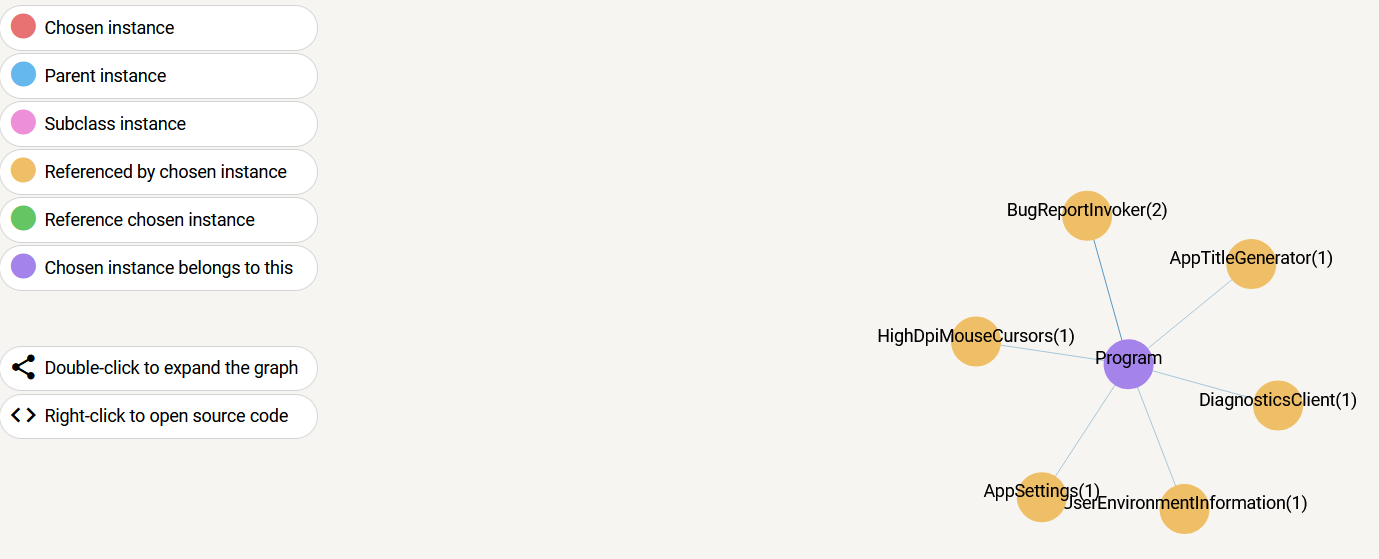
Analysis of instances that need to be annotated For each instance from the project, it is possible to analyze several aspects, such as the source code, the related instances and the relationship graph.
-
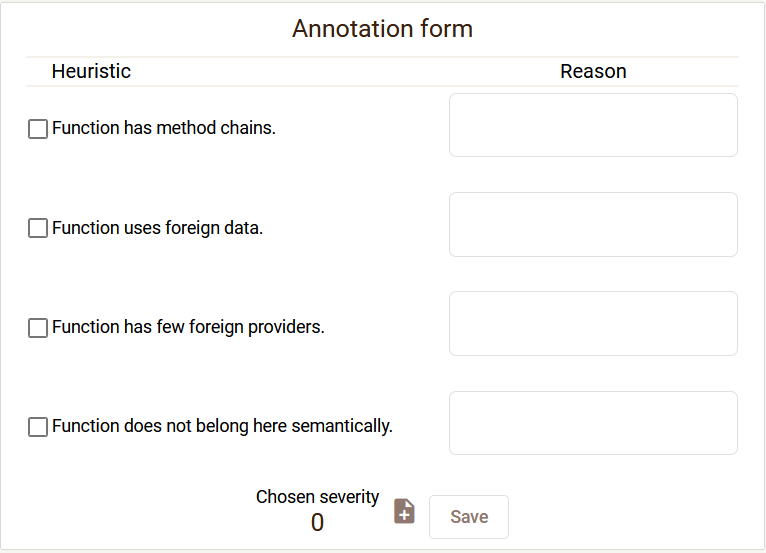
Simultaneous annotation of instances by a group of annotators During annotation, the annotator fills in the annotation form.
-
Determining dataset instances that require further annotations (e.g., those annotated by a single annotator or where there is no consensus for the final label). During annotation, it is possible to filter instances that do not have enough annotations, as well as instances that have disagreeing annotations. During the review of disagreeing annotations, it is possible to see the completed annotation forms of all annotators, and after the discussion of the annotators, the annotations should be changed so that the annotators agree.
-
Calculating annotation consistency regarding code metrics for one or multiple annotators. For each project in the dataset, it is possible to check the consistency of the annotations:
- Calculating consistency for one annotator
- Calculating code metrics significance for a single annotator
- Calculating consistency between annotators
- Calculating code metrics significance between annotators
-
Exporting an annotated dataset to excel files. At any moment, it is possible to export a dataset, whereby all information related to existing annotations will be saved in an excel file.
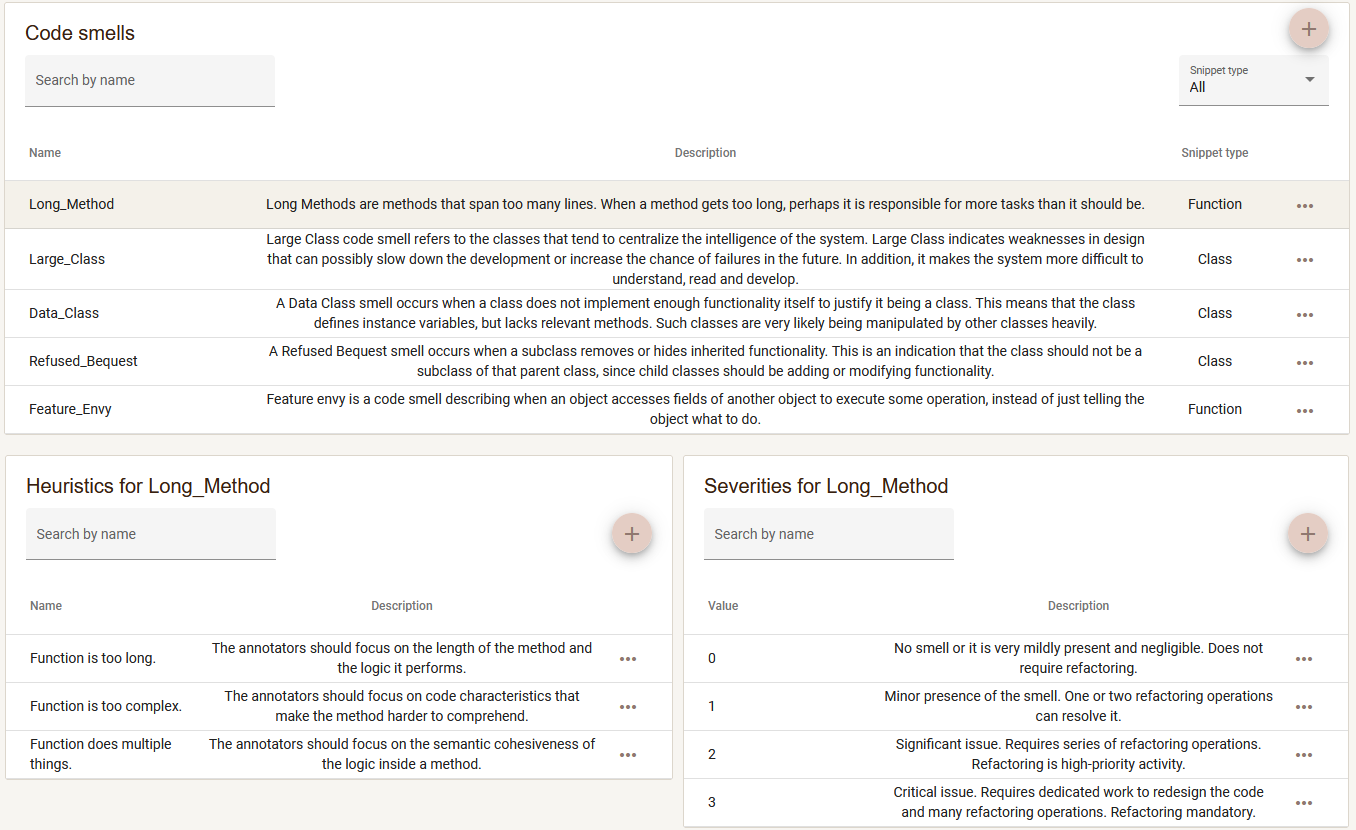
-
Defining annotation scheme Annotators can modify the annotation scheme by adding new code smells, heuristics and severities that can be assigned during annotation.