Live AI coding monitor — real-time trace, quota guard, and MCP server
Most tools read your logs after a session ends. claudestat hooks into every event as it fires. See what your AI is spending right now, get alerted before you hit your quota, and ask Claude about its own usage — from inside the terminal.
Works with Claude Code and OpenCode. Zero cloud dependencies. Pure Node.js. Runs on macOS, Linux, and Windows.










Installation • Quick Start • Commands • Dashboard • Library API • FAQ • Discussions • Contributing
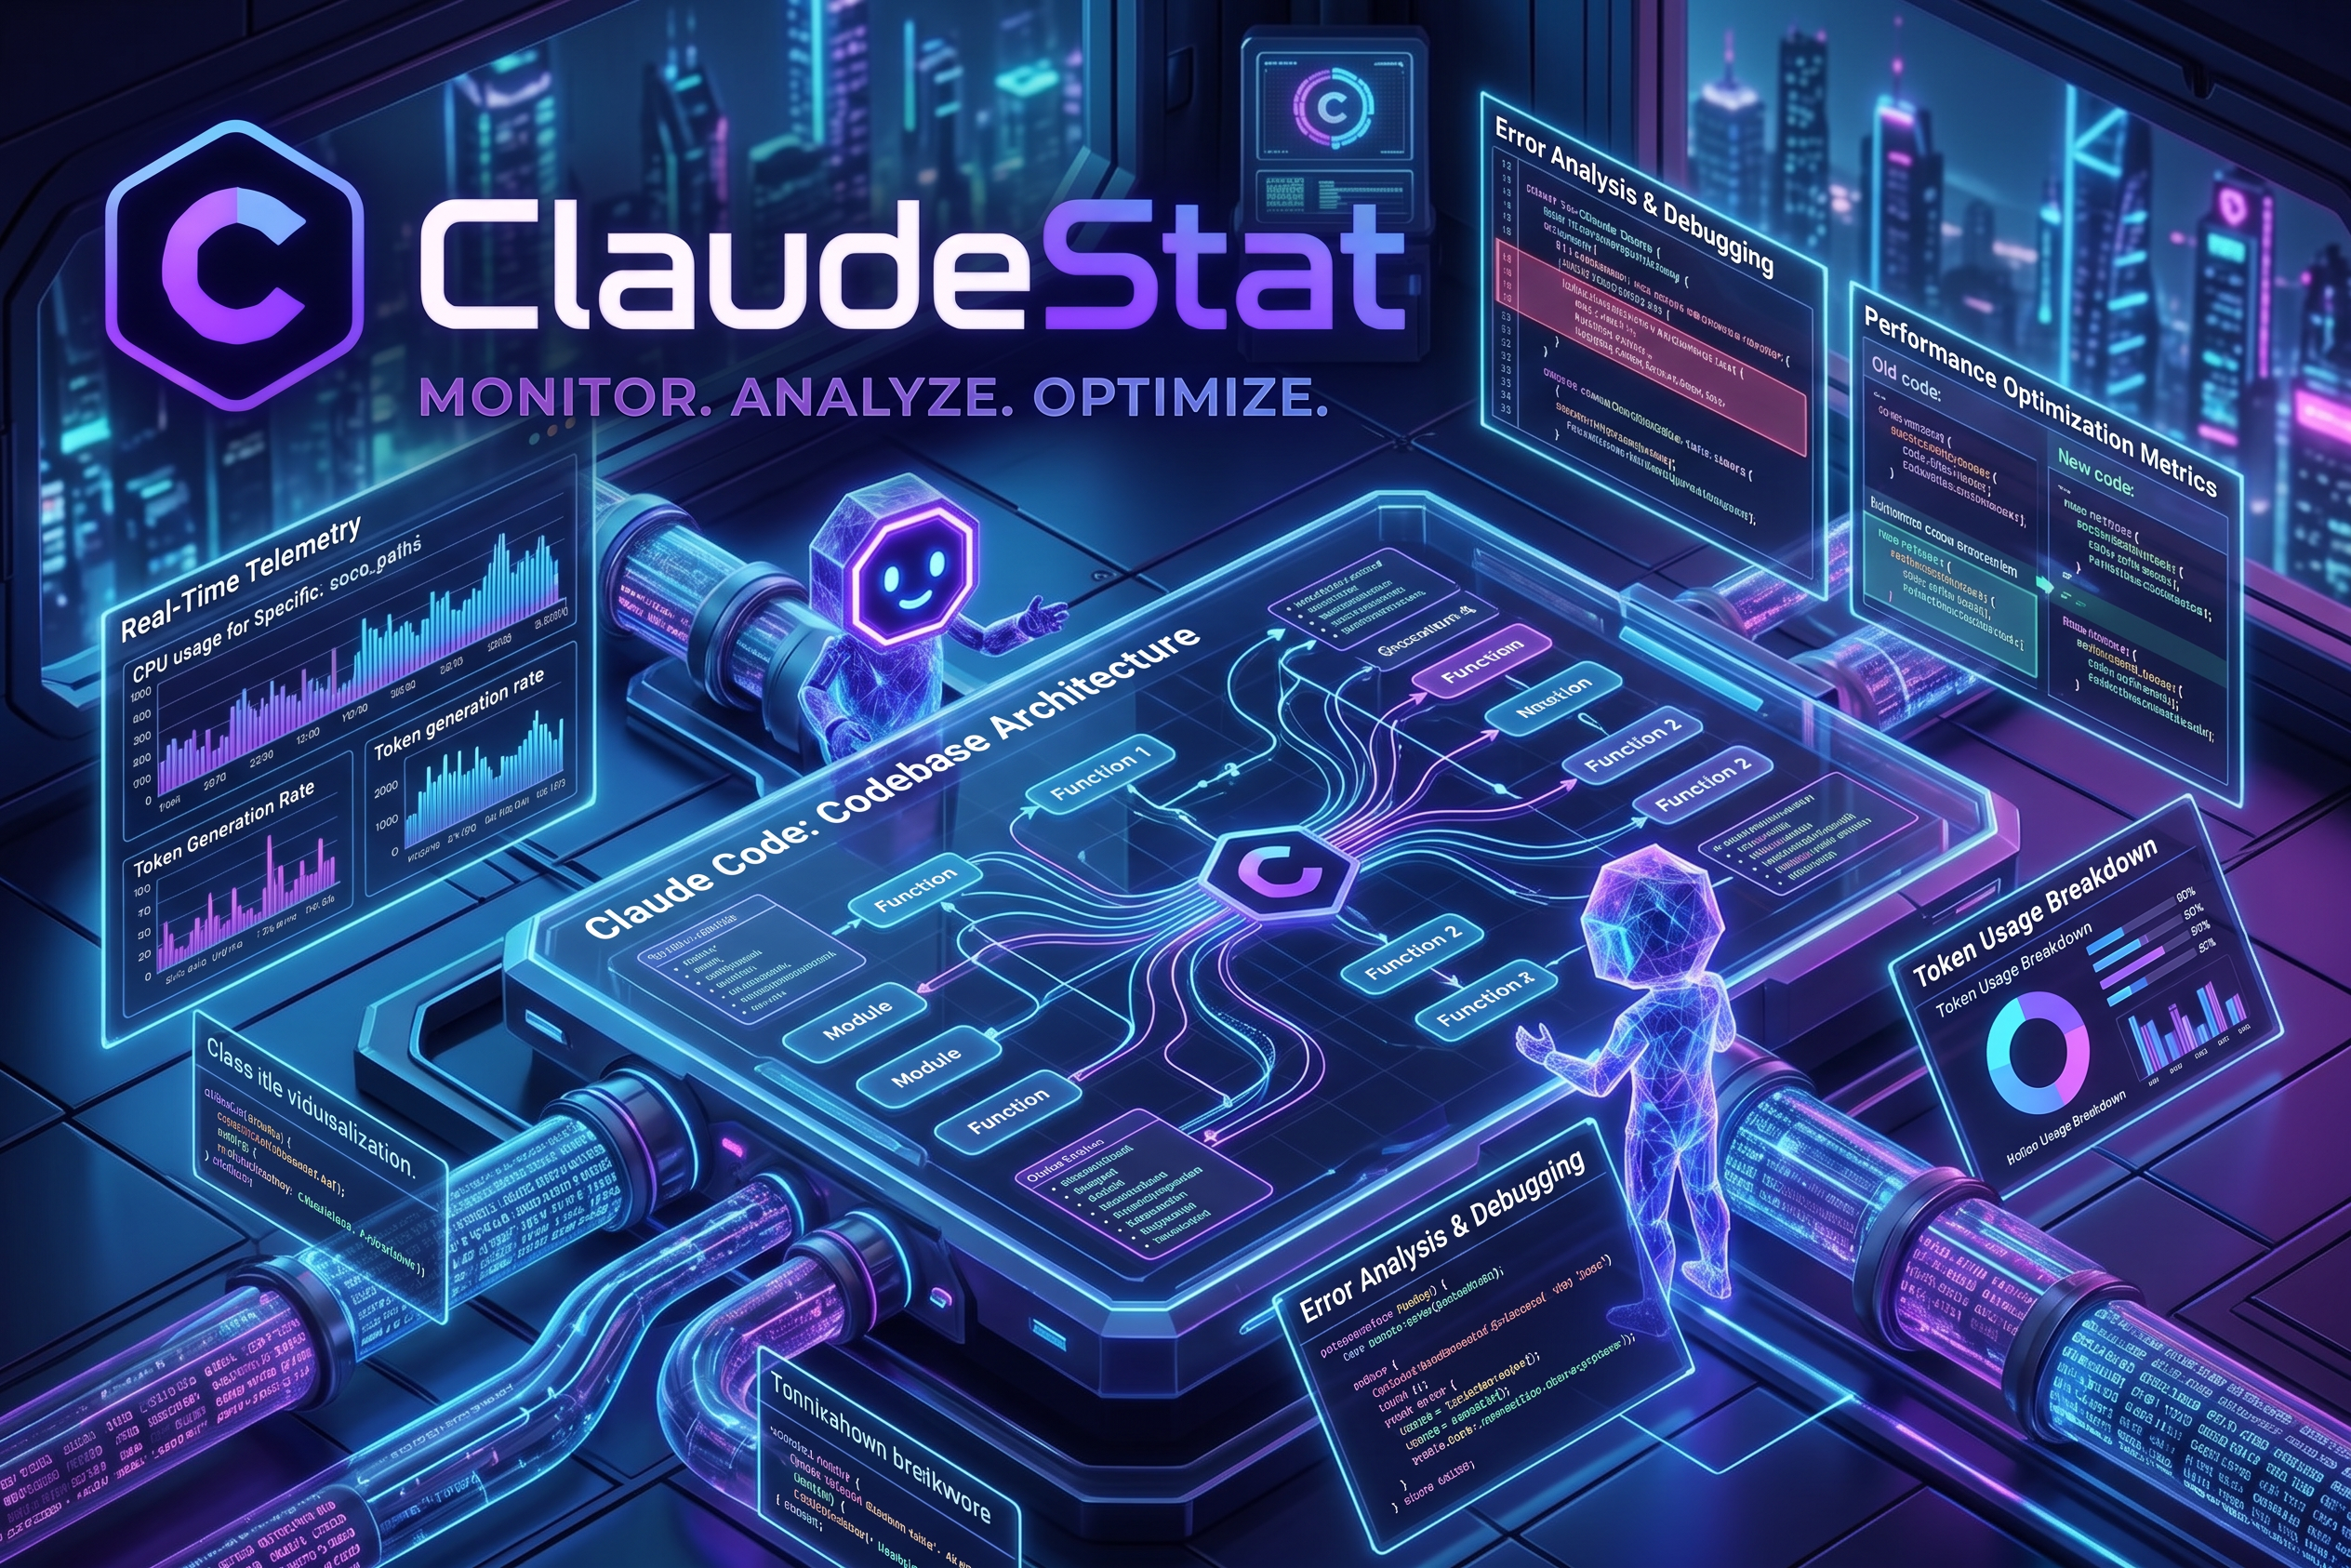
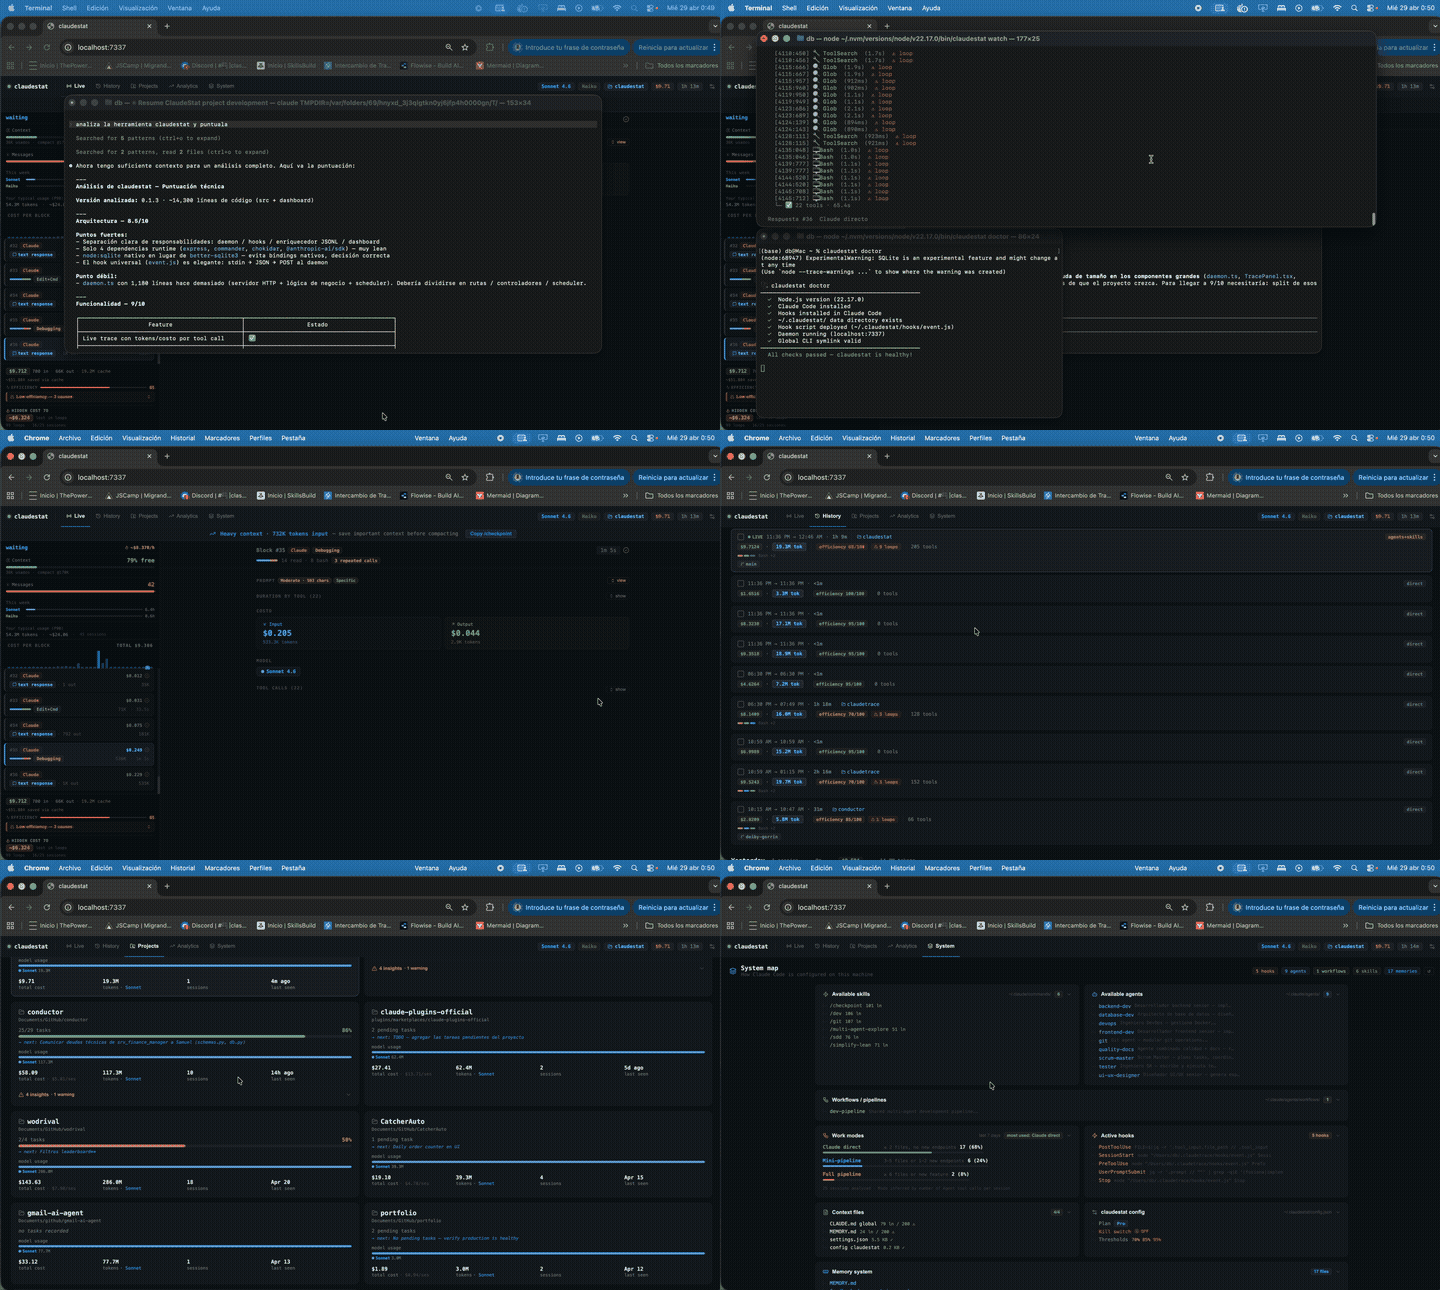
Live dashboard · terminal trace · quota guard — all running in real time
- Why claudestat?
- Ask Claude about itself
- Features
- Quick Start
- Requirements
- Installation
- Commands
- Dashboard
- Library API
- OpenCode Support
- MCP Server
- MCP Bundle (standalone)
- Configuration
- Troubleshooting
- FAQ
- Uninstall
- Contributing
- License
Two different jobs exist in the coding-agent space:
- What happened — costs, token totals, daily/weekly/monthly reports. ccusage is the historical-analysis reference.
- What is running right now — the live session, the live budget, before the quota runs out. claudestat and OpenUsage live here.
claudestat hooks Claude Code's events the moment they fire, keeps everything local in SQLite, and surfaces a live web dashboard, quota alerts, and an MCP server.
| claudestat | ccusage | OpenUsage | |
|---|---|---|---|
| Real-time event stream | ✅ | partial | ✅ |
Live terminal trace (watch) |
✅ | — | — |
| Web dashboard | ✅ | — | TUI |
| Quota alerts + kill switch | ✅ | — | quota only |
| Loop / thrash detector | ✅ | — | — |
| MCP server (ask Claude about itself) | ✅ | — | — |
| Historical daily/weekly/monthly reports | ✅ | ✅ | partial |
| Multi-CLI sources (Codex, OpenCode, Amp…) | ✅ | ✅ | ✅ |
| Cross-provider spend in one view | focused | — | ✅ |
| Local-first / SQLite (no cloud) | ✅ | ✅ | ✅ |
The main difference is the moment: ccusage answers what did I spend yesterday; claudestat shows what's happening while you code.
If claudestat is useful, give it a ⭐ — it helps other developers find it.
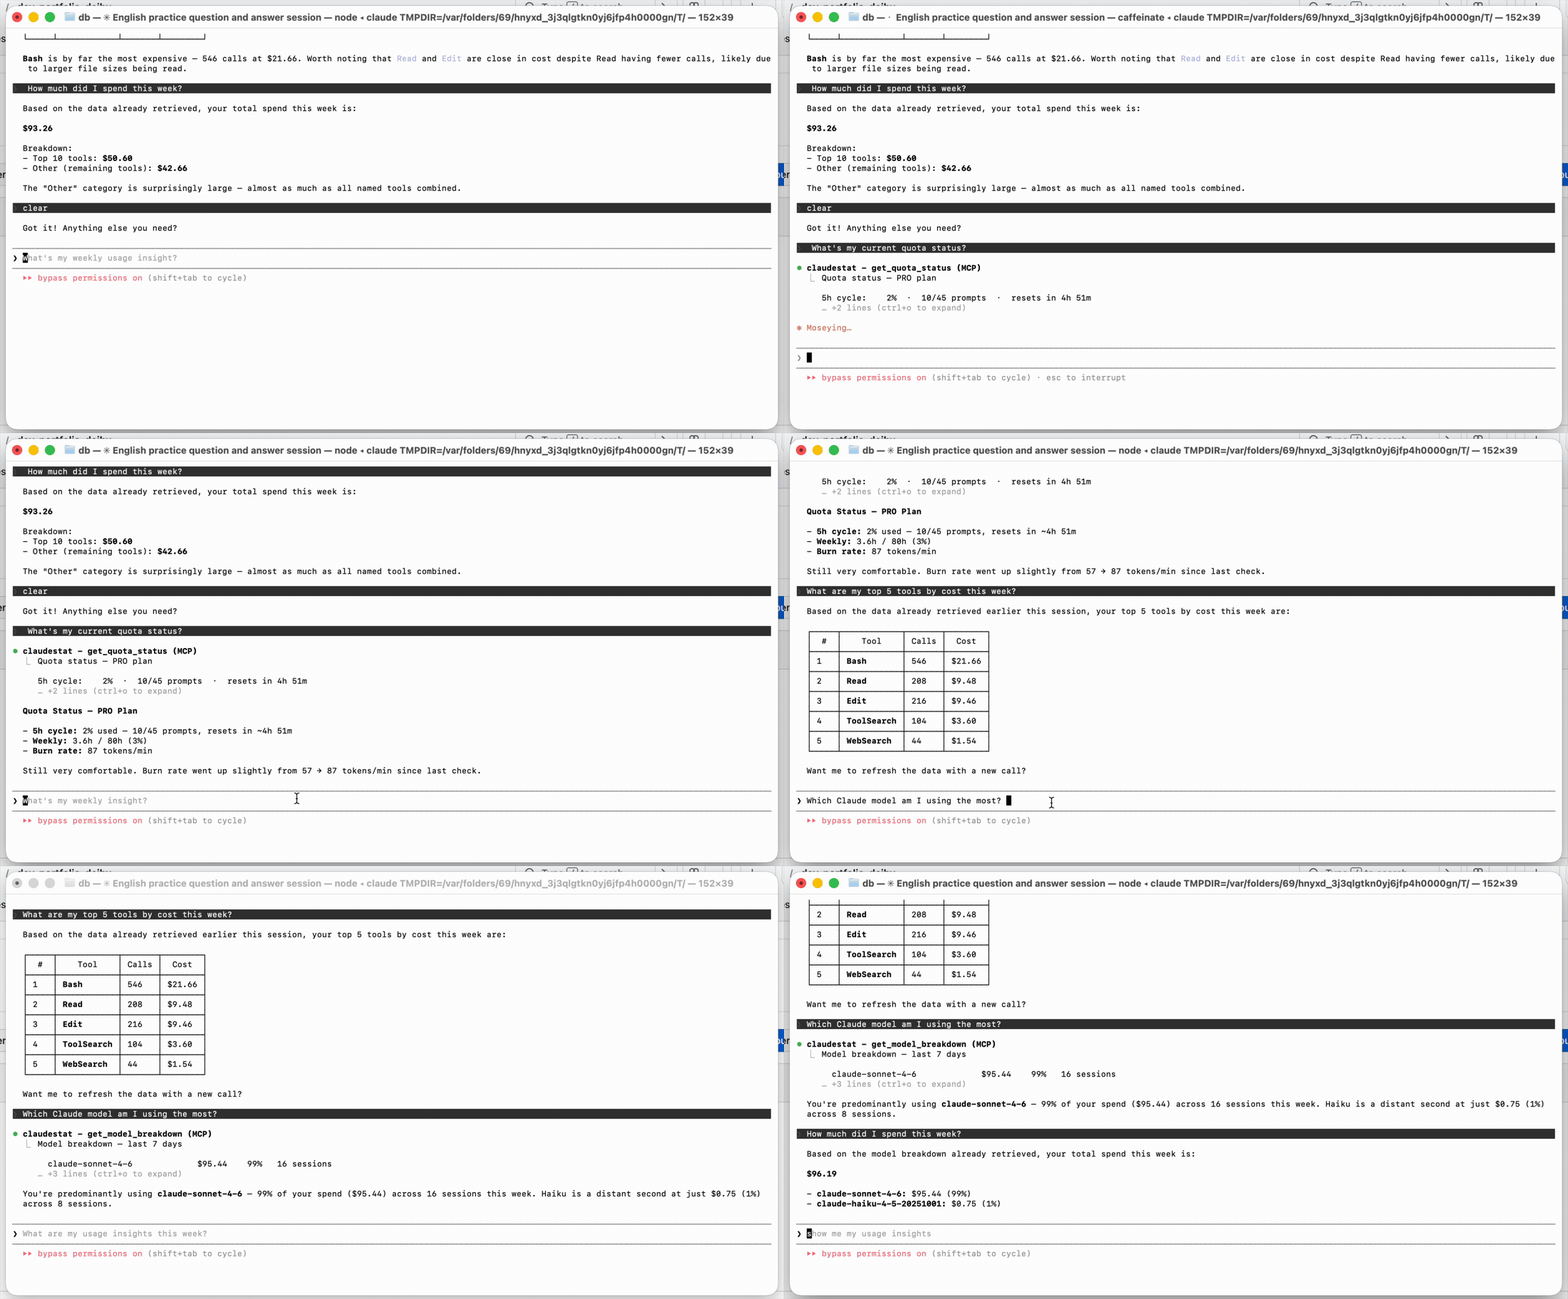
claudestat ships an MCP server. Once registered, you can ask Claude Code questions about its own usage — without leaving the terminal.
claude mcp add claudestat -s user -- claudestat-mcpThen just ask:
> How much did I spend this week?
> What are my top 5 tools by cost?
> Break down my usage by model
> What's my cost projection for next month?
- Live tool trace — every call with duration and token cost as it runs
- OpenCode support — same live dashboard for OpenCode sessions (tool calls, prompts, model, intent)
- Quota guard — alerts at 70%, 85%, 95%; optional kill switch blocks new sessions at X%
- Loop detector — flags context thrashing with estimated waste cost
- Top tools — know which tools eat most of your budget; expandable "Other" row reveals tools beyond top 10
- Cost projection — linear regression with trend, confidence intervals, R²
- Billing blocks — track 5-hour billing windows and cumulative spend per block (
claudestat blocks) - Session sharing — export any session summary as formatted ASCII or JSON (
claudestat share) - 52-week activity heatmap — visualize your coding activity across the full year in Analytics
- Period-over-period deltas — Analytics KPIs show ↑↓% trend vs. the previous period
- Projects search & filter — find projects instantly; filter by activity, cost, or efficiency threshold
- Orchestration Command Center — live swim-lane view of CC+OC multi-agent runs: per-cycle cost, tokens (with cache), files changed, git commits, and model breakdown; cycle traces survive log rotation
- Web dashboard — 7 tabs: Live, History, Projects, Analytics, Top, System, Orchestrate
- MCP server — 9 tools so Claude can answer questions about its own usage; standalone bundle available as
@statforge/claudestat-mcp-bundle - Weekly insights — pattern analysis with actionable tips
- Multi-source — switch between Claude Code and OpenCode sessions in one click
- Source filter — filter KPIs, charts, and tool rankings by Claude Code / OpenCode across all tabs
- Multi-tool coordination — live intent panel with real collision detection (same file edited by CC and OC)
- Programmatic Library API — import
dbOps, pricing, and intelligence functions directly from your own tools (v1.13.0+,@experimental)
npm install -g @statforge/claudestat && claudestat setup
open http://localhost:7337
Start a Claude Code session and watch the events flow in. That's it.
- Node.js >= 22 (required for
node:sqlite) - Claude Code installed (
npm install -g @anthropic-ai/claude-code)
npm install -g @statforge/claudestat && claudestat setupclaudestat setup installs the Claude Code hooks and registers the daemon as a system service — no sudo required. The daemon starts automatically whenever you log in (launchd on macOS, systemd on Linux, Scheduled Task on Windows).
Using NVM? Make sure you're on your default Node version:
nvm use default && npm install -g @statforge/claudestat && claudestat setupRestart Claude Code after setup so the hooks take effect.
npm install -g @statforge/claudestat
claudestat install   # installs hooks into Claude Code
claudestat start # start the daemon manually| Command | Description |
|---|---|
claudestat setup |
One-command setup: install hooks + register daemon as system service |
claudestat setup --uninstall |
Remove hooks and system service |
claudestat start / stop / restart |
Manage the background daemon |
claudestat install / uninstall |
Install or remove Claude Code hooks |
claudestat watch |
Live terminal trace view |
claudestat status |
Show quota, cost, and burn rate |
claudestat top |
Rank tools by cost, call count, or duration |
claudestat weekly |
Weekly usage summary |
claudestat insights |
Deep usage insights: cost, cache, efficiency, models |
claudestat project |
Cost projection with linear regression |
claudestat config |
View or edit configuration |
claudestat doctor |
Check installation health and diagnose issues |
claudestat blocks |
Show 5-hour billing block history |
claudestat share [session-id] |
Export session summary as ASCII or JSON (use --copy to copy to clipboard) |
claudestat export [format] |
Export session data to JSON or CSV |
claudestat roast |
Sarcastic usage analysis |
claudestat resume |
Resume a paused session |
claudestat loops |
List sessions with detected loops (context thrashing) |
claudestat logs |
Show daemon logs (use -n, --follow, --level) |
claudestat update |
Check for updates and install the latest version from npm |
claudestat version |
Show version and check for updates |
Full command reference with output examples →
The dashboard lives at http://localhost:7337 and has seven tabs: Live, History, Projects, Analytics, Top, System, and Orchestrate.
claudestat was engineered by a human developer working with AI as a pair programming partner. The AI accelerated implementation — architecture, design, and engineering decisions stayed human. Fittingly, claudestat measures itself: every metric below comes from its own event database.
| Human-owned | AI implemented, always human-reviewed |
|---|---|
| Product vision & feature design | TypeScript service generation |
| MCP server protocol & design | Tool scaffolding, dashboard components |
| Data model (SQLite schema) | Refactoring, test scaffolding |
| Architecture decisions | Config parsing, CLI commands |
| Code review & final acceptance | Documentation, auxiliary scripts |
Workflow: Idea → Spec → AI implementation → Human review → Test → Refine → Merge
Development was iterative, never a single prompt: requirements → prepare context → generate → review → fix → validate → repeat. Code and tests shipped together; nothing merged without human review. PRs stayed within budget and were split with /chained-pr when needed.
- AI never made product decisions.
- Every implementation started from a written specification.
- Documentation was treated as executable context for AI.
- All generated code required human review.
- Architecture was preserved over implementation speed.
- Models were selected per task type (Claude Code for complex features, OpenCode for fast iterations).
Supporting metrics
| Metric | Value |
|---|---|
| AI sessions | 116 logged |
| Measured development time | ~344 h |
| Avg session efficiency | 77/100 |
| Primary model | Claude Sonnet 4.6 (48 CC sessions) |
| Secondary | OpenCode: DeepSeek V4 Flash/Pro, GLM-5, Mimo v2.5 (68 sessions) |
Measured with ClaudeStat — this project's own tracking tool. Approximate values.
When you run OpenCode alongside Claude Code, claudestat automatically detects both sessions and shows a source switcher in the Live tab.
Click between Claude Code and OpenCode to see each session's real-time view — tool calls, prompts, model name, intent badges, and timing — without leaving the dashboard.
| Feature | Claude Code | OpenCode |
|---|---|---|
| Tool calls (Read, Write, Bash, Edit…) | ✅ | ✅ |
| Prompts per block | ✅ | ✅ |
| Model name | ✅ | ✅ |
| Intent detection (Exploring / Implementing…) | ✅ | ✅ |
| Session cost | ✅ | ✅ |
| Weekly usage chart | ✅ | ✅ |
| Per-block cost breakdown | ✅ | — |
| Quota / context window | ✅ | — |
OpenCode data is read directly from its local SQLite database — no configuration required.
claudestat includes an MCP server with 9 tools for querying usage stats. Register once:
claude mcp add claudestat -s user -- claudestat-mcpThen ask Claude: "What's my quota status?", "Show me my latest session", "Top 5 tools by cost", "How's my context window doing?", "What's my daily summary?".
The server also sends push notifications for context saturation (50/75/90%), weekly quota thresholds, and 5h billing cycle limits — Claude will proactively warn you without you asking.
Since v1.16.0, the MCP server runs on the official @modelcontextprotocol/sdk (v1.30.0) instead of a hand-rolled JSON-RPC engine. That means standards-compliant handshakes, protocol-version negotiation with modern MCP clients, reliable startup/shutdown on stdin EOF, and proper input validation for tool arguments. The public API is unchanged, so existing registrations keep working as-is.
| Tool | Description |
|---|---|
get_quota_status |
5h cycle %, weekly hours per model, burn rate, plan detection |
get_current_session |
Latest session cost, tokens, efficiency, loops |
get_session_stats |
Aggregated stats for the last N days |
get_top_tools |
Top 10 tools by cost, count, or duration |
get_usage_insights |
Cost per project, cache savings, output/input ratio, peak hours |
get_model_breakdown |
Cost and sessions broken down by Claude model |
get_weekly_insight |
Weekly summary with actionable tip |
get_context_status |
Current context window usage with saturation bar |
get_daily_summary |
Today vs yesterday vs 7d average |
Prefer a lighter dependency? Install the MCP server as a standalone package — no CLI, no daemon, just the stdio MCP server and its SQLite reader:
npm install -g @statforge/claudestat-mcp-bundle
claude mcp add claudestat -s user -- npx @statforge/claudestat-mcp-bundle
Same 9 tools, same context notifications, zero extra footprint.
@experimental(v1.13.0+) — the programmatic surface may change in any minor/patch release until v2.0.0. Pin to exact versions when integrating.
claudestat ships a TypeScript library entry alongside the CLI. Build exporters, alerters, and integrations that read session data directly — no spawn, no output parsing.
import { dbOps, analyzeSession, computeProjection, configure } from '@statforge/claudestat'

// Opt out of the daemon-required guard (CI / batch jobs):
configure({ throwOnNoDaemon: false })

const sessions = dbOps.getAllSessions(20)
const report   = analyzeSession(events, costUsd)
const forecast = computeProjection(30)
By default the first dbOps.* call probes http://127.0.0.1:7337/health and throws DaemonNotRunningError if the daemon is down. Pure functions (findPricing, analyzeSession, computeProjection, …) never probe.
| What | Stability |
|---|---|
dbOps (50+ read-only query functions) |
@experimental — lazy daemon-guarded |
Pricing tables (MODEL_PRICING, KNOWN_CONTEXT_WINDOWS, PRICING) |
@experimental |
Intelligence (analyzeSession, detectLoops, predictSaturation, …) |
@experimental |
Forecasting + quota (computeProjection, computeQuota, …) |
@experimental |
configure({throwOnNoDaemon}) |
@experimental |
Full library reference + 3 worked examples →
Config is stored at ~/.claudestat/config.json. View it with claudestat config or edit the file directly.
claudestat config --kill-switch true --threshold 90
claudestat config --plan max5
claudestat config --alerts false
Full configuration reference →
Claude Code / OpenCode event
      │
      ▼
  Hook script  (~/.claudestat/hooks/event.js)
       │  POST JSON → daemon
       ▼
  Daemon  (localhost:7337)
       │  stores events in SQLite
       │  enriches with JSONL token data
       │  runs pattern analyzer
       │  context/quota push notifications
       ▼
  ┌──────────────────────────────────┐
  │  Dashboard (React + Vite)        │
  │  Terminal (claudestat watch)     │
  │  MCP Server (9 tools)            │
  │  Library API (dbOps, pricing)    │
  └──────────────────────────────────┘
              │
              ▼
  You see everything — live
claudestat start hangs for ~5 seconds
Normal — require('express') takes a few seconds on first load. The daemon is running; wait for the "Daemon started" confirmation.
Hooks are not firing / dashboard shows no events
Run claudestat doctor — it checks every component and prints the exact fix command.
claudestat command not found after install
If using NVM, the binary may point to the wrong Node version:
nvm use default && npm install -g @statforge/claudestat && hash -r claudestatKill switch is blocking new sessions
Disable with claudestat config --kill-switch false, or wait for the 5h quota window to reset.
Approaching rate limit
The daemon polls quota every 60s and logs warnings at 70%, 85%, and 95%. Check anytime with claudestat status.
Working with multiple projects claudestat tracks every project automatically. The Projects tab groups sessions by working directory.
Dashboard shows 0 cost / $0.00 for all sessions
Token data comes from Claude Code's JSONL files, not from hook events. Make sure Claude Code is writing JSONL logs — check ~/.claude/projects/ for .jsonl files. If the directory is empty, Claude Code may not have logging enabled.
Daemon stops after terminal closes
The daemon must be started with nohup to persist beyond the shell session:
nohup claudestat start &Or use claudestat setup which installs a system service (launchd on macOS, systemd on Linux, Scheduled Task on Windows).
claudestat export produces empty output
If no sessions appear, the daemon may not have been running during your Claude Code sessions. Check claudestat status and restart with claudestat start. For historical data only (without a running daemon), export still reads from the local SQLite database — so past sessions captured while the daemon was running are always available.
Loop detector fires too often / not enough Adjust the threshold and window:
claudestat config --loop-threshold 5   # default: 8 calls
claudestat config --loop-window 90     # default: 120 seconds
MCP server not responding
Restart the daemon (claudestat restart) and verify it's registered:
claude mcp listIf not listed, re-run: claude mcp add claudestat -s user -- claudestat-mcp
OpenCode sessions not appearing
claudestat reads OpenCode data from ~/.local/share/opencode/opencode.db. If the file does not exist, OpenCode has not run yet or uses a different data path on your system. Run opencode at least once to initialize it.
Node.js experimental SQLite warning on startup
Expected — node:sqlite is experimental in Node 22. The warning is suppressed automatically. If you see it repeatedly, ensure you are running Node.js 22 or later (node --version).
What is claudestat? How is it different from ccusage? claudestat is a real-time monitor for Claude Code — not a log reader. It hooks into every tool call as it fires, tracks token usage and cost live, guards your quota with configurable alerts, and exposes an MCP server. ccusage reads JSONL history after sessions end; claudestat runs while you code.
How do I track Claude Code costs?
Install with npm install -g @statforge/claudestat && claudestat setup, then open http://localhost:7337 for the live dashboard. Use claudestat status for a quick summary or claudestat export for full data export.
Does claudestat work with Claude Pro, Max 5, and Max 20?
Yes. claudestat auto-detects your plan. You can also force it with claudestat config --plan max5.
Is my data sent to any server?
No. All data is stored locally in SQLite at ~/.claudestat/. Zero cloud dependencies.
Does claudestat work on Windows?
Yes — macOS, Linux, and Windows are all supported. On Windows, claudestat setup registers a Scheduled Task for auto-start, clipboard uses clip, and the daemon health check uses Node's built-in HTTP client.
What is the MCP bundle?
@statforge/claudestat-mcp-bundle is a standalone npm package containing only the MCP server — no CLI, no dashboard, no daemon. Install it if you want Claude to query its own stats via MCP without running the full claudestat daemon.
Can I use claudestat programmatically?
Yes. Import dbOps, computeProjection, analyzeSession, createMcpServer and other functions directly from @statforge/claudestat. See the Library API section.
claudestat setup --uninstall                          # remove hooks + system service
rm -rf ~/.claudestat                                  # macOS / Linux
Remove-Item -Recurse -Force "$env:USERPROFILE\.claudestat"  # Windows (PowerShell)
If you installed manually, use
claudestat uninstallto remove only the hooks. On Windows,claudestat setup --uninstallalso removes the Scheduled Task.
PRs are welcome! See CONTRIBUTING.md for full guidelines.
git clone https://github.com/YOUR_USERNAME/claudestat
cd claudestat
npm install
node --require tsx/cjs tests/index.ts   # run all tests
Good first areas: pattern analyzer (src/pattern-analyzer.ts), dashboard components (dashboard/src/components/), new commands.
MIT — use it, fork it, ship it.