
FinOptima is an AI-driven financial analytics platform built for OSC AI Build 1.0, a global hackathon organized by Open Source Connect (OSC). The project combines live market data, machine learning, clustering, and portfolio optimization to help users analyze stocks and generate smart investment insights in an interactive dashboard.


.png)
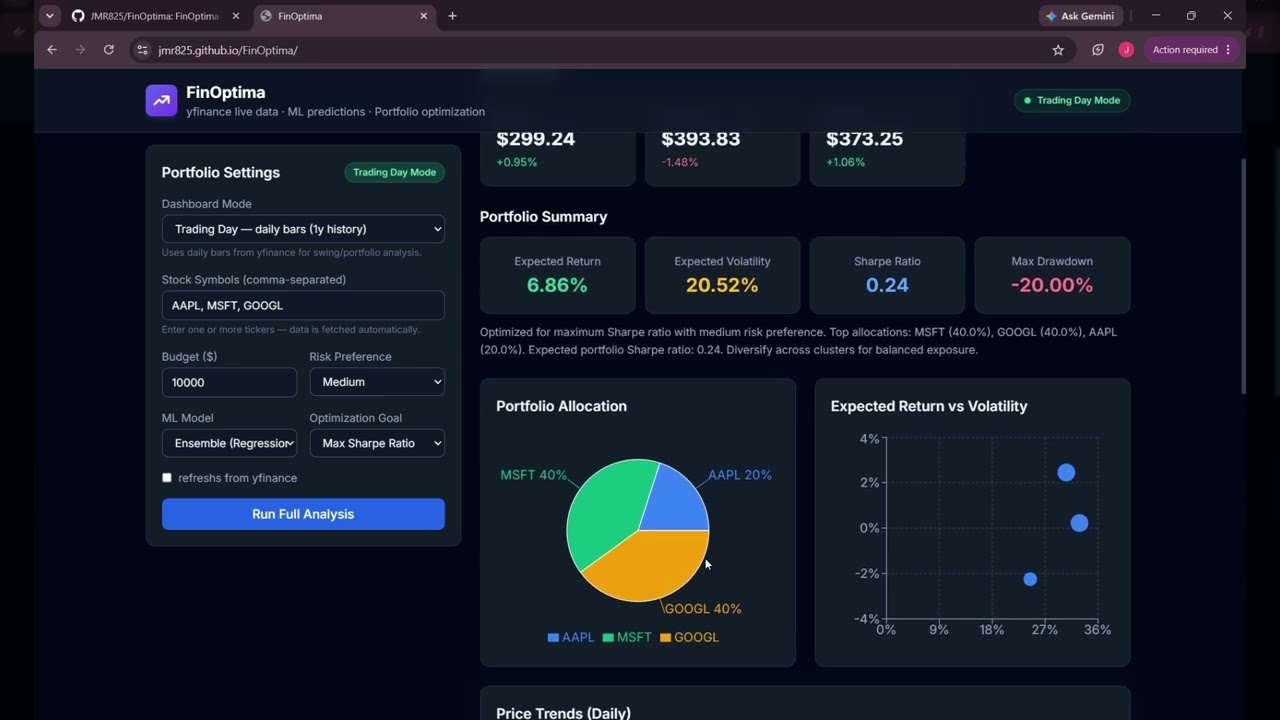
.png)

FinOptima is designed to showcase how open-source AI can be applied to financial decision-making. Users enter stock symbols and investment preferences, and the system fetches market data, engineers financial features, predicts short-term returns using machine learning, groups similar assets through clustering, and computes optimized portfolio allocations. The results are displayed in a clean, responsive dashboard with live prices, prediction signals, risk metrics, and allocation charts.
📘 Comprehensive technical documentation including ML model details, training methodology, feature engineering, evaluation metrics, benchmarks, and sample outputs is available at
docs/TECHNICAL_DETAILS.md.
This hackathon project focuses on building a practical AI system that is:
- Open-source friendly and easy to extend.
- Demo-ready with live and offline data modes.
- Technically strong with ML, optimization, and dashboard visualization.
- Highly practical for portfolio analysis and risk-aware investment planning.
- Integrate live and historical stock data using a pluggable market data provider.
- Preprocess time-series data with returns, moving averages, volatility, and RSI.
- Predict short-term returns using regression-based models and an optimized batch LSTM.
- Cluster stocks for diversification insights.
- Optimize portfolio allocations for maximum Sharpe ratio or minimum volatility.
- Present all results in a polished, hackathon-friendly dashboard.
- Data Ingestion — Pluggable market data provider layer using
yfinance. - Preprocessing — Clean, sort, and engineer features from raw OHLCV data.
- Regression Matrix — Linear Regression + Random Forest predict next-period returns; best model selected by MAE.
- Batch LSTM Engine — Sequence model on closing price/return/RSI windows running 100% in-memory via concurrent batching.
- Unsupervised Clustering — KMeans clustering on return, volatility, momentum, and RSI features.
- Mathematical Optimization — SciPy SLSQP execution with long-only constraints (weights sum to 1).
- Dashboard UI — React + Recharts visualize allocation, risk-return scatter, trends, and data tables.
| Metric | Local (8-core, 16 GB) | Render Free Tier (512 MB) |
|---|---|---|
| Full pipeline (5 symbols, no LSTM) | ~3–5 s | ~20–30 s |
| Full pipeline (10 symbols, no LSTM) | ~5–8 s | ~40–60 s |
| LSTM training (8 epochs, 5 symbols) | ~8–12 s | Disabled (OOM risk) |
| Memory usage (5 symbols) | ~200 MB | ~350 MB |
| Data freshness | Real-time | Up to 2 min delay (yfinance cache + rate limits) |
Key differences:
- Local execution uses unthrottled CPU and full RAM for fast model training.
- Render free tier runs on shared CPU with 512 MB RAM ceiling. All operations are optimized for in-memory execution — no disk I/O, no SQLite, no CSV writes.
- LSTM is disabled on Render (
ENABLE_LSTM=false) because TensorFlow allocates 300–400 MB at load time, exceeding the free tier limit during concurrent requests.
To evaluate the high-performance execution of the full optimization engine locally, spin up the modules using these terminal configurations:
Open your terminal inside the root project directory and execute:
# Navigate to backend directory
cd backend

# Create and trigger your Python virtual environment
python -m venv venv
source venv/bin/activate  # On Windows use: venv\Scripts\activate

# Install required numerical and ML packages
pip install -r requirements.txt

# Launch the Uvicorn web server
uvicorn app.main:app --reload --port 8000
Your local API endpoints documentation framework will become available at http://localhost:8000/docs.
Open a separate terminal window and launch the UI engine:
# Navigate to frontend directory
cd ../frontend

# Install modern component and utility dependencies
npm install

# Run the local Vite dev server
npm run dev
Dashboard hosting will begin locally at http://localhost:5173.
| Layer | Technology |
|---|---|
| Frontend | React, Vite, Tailwind CSS, Recharts |
| Backend | FastAPI, Pydantic |
| ML & Analytics Engine | pandas, numpy, scikit-learn, scipy, TensorFlow/Keras |
| Market Data | yfinance |
| Development (IDE) | Cursor AI, VS Code |
ai-portfolio-optimizer/
├── backend/
│   ├── app/
│   │   ├── api/routes.py          # REST endpoints
│   │   ├── services/
│   │   │   ├── market_data_service.py
│   │   │   ├── preprocessing.py
│   │   │   ├── regression_predictor.py
│   │   │   ├── lstm_predictor.py
│   │   │   ├── clustering.py
│   │   │   ├── risk_metrics.py
│   │   │   ├── optimizer.py
│   │   │   └── output_formatter.py
│   │   ├── models/schemas.py
│   │   └── utils/
│   ├── requirements.txt
│   └── run.py
├── frontend/
│   └── src/components/            # Dashboard UI components
├── sample_data/                   # Auto-generated CSV datasets
└── scripts/
| Method | Endpoint | Description |
|---|---|---|
| GET | /api/health |
Health check |
| POST | /api/live-data |
Latest market prices |
| POST | /api/analyze |
Preprocessing + risk metrics |
| POST | /api/predict |
ML predictions |
| POST | /api/cluster |
Stock clustering |
| POST | /api/optimize |
Portfolio optimization |
| POST | /api/full-analysis |
Complete pipeline (dashboard) |
Complete workflow: stock selection → model execution → prediction generation → portfolio optimization results.
A complete sample request and response is documented in docs/TECHNICAL_DETAILS.md.
Quick example (5-stock daily analysis with optimization_goal="max_sharpe", risk_preference="medium"):
| Asset | Weight | Predicted Return | Trend | Confidence |
|---|---|---|---|---|
| AAPL | 25% | +0.85% | Upward | 72.3 |
| MSFT | 20% | +0.62% | Upward | 68.1 |
| GOOGL | 15% | +0.38% | Upward | 55.4 |
| NVDA | 30% | +1.10% | Upward | 81.5 |
| TSLA | 10% | -0.22% | Downward | 45.2 |
| Metric | Value |
|---|---|
| Expected annual return | 12.45% |
| Expected annual volatility | 18.20% |
| Sharpe ratio | 0.574 |
| Max drawdown | -28.30% |
| VaR (95%) | -2.45% |
| CVaR (95%) | -3.08% |
Full JSON response structure is shown in the technical documentation.
FinOptima produces:
- Predicted returns for each asset.
- Trend signals such as upward, downward, or neutral.
- Confidence scores for predictions.
- Cluster labels for similar stocks.
- Portfolio weights and risk metrics.
This project is a strong hackathon submission because it combines:
- AI/ML
- Financial analytics.
- Real-world usability.
- Open-source extensibility.
- A visually appealing frontend demo.
- Free API tiers may have sudden provider request rate limits.
- Predictions are educational and do not constitute professional financial advice.
- Real-time stream data sync updates use polling in the first version instead of WebSockets.
- WebSocket-based live updates.
- More data providers.
- Saved portfolios and user accounts.
- Backtesting module.
- Sentiment analysis from news.
- Cloud deployment.
FinOptima was developed efficiently during the hackathon using AI pair-programming tools (e.g., Cursor, Perplexity) for code generation, boilerplate setup, and UI styling adjustments. All core financial logic, ML routing, and system architecture were designed and engineered by the team.
Built for OSC AI Build 1.0 as an open-source educational hackathon project.
This project is licensed under the MIT License - see the LICENSE file for details.
Disclaimer: FinOptima is an educational hackathon project and does not constitute formal financial or investment advice.