This resource adds a Prometheus endpoint to your FX Server.
There are some default metrics available and you can add yours.
Go to your FiveM resource directory;
git clone <repo>
Rename fivem-prometheus to prometheus:
mv fivem-prometheus prometheus
Include convars (Check Convars section) and ensure the prometheus on server.cfg:
...
set prometheus_auth_enabled 0
set prometheus_timeout 5000
set prometheus_login "admin"
set prometheus_password "admin"
ensure prometheus
...
Restart your server and go to "Prometheus configuration";
| Name | Type | Description |
|---|---|---|
| fxs_player_count | Gauge | Number of connected players |
| fxs_player_connections | Counter | Number of player connections |
| fxs_player_disconnections | Counter | Number of player disconnections |
| fxs_average_player_latency | Gauge | Average player latency |
| fxs_players_latency | Histogram | Players latency |
| fxs_min_player_ping | Gauge | Minimum player ping |
| fxs_max_player_ping | Gauge | Maximum player ping |
Convars available:
| Name | Type | Default value | Description |
|---|---|---|---|
| prometheus_timeout | int | 5000 | Interval in ms to collect data |
| prometheus_auth_enabled | int | 0 | Protects the endpoint with credentials if true (1) |
| prometheus_login | string | "admin" | Endpoint login |
| prometheus_password | string | "admin" | Endpoint password |
# A scrape configuration containing exactly one FXS endpoint to scrape.
scrape_configs:
  - job_name: 'fxserver'
    scrape_interval: 60s
    basic_auth:
      username: admin
      password: admin
    metrics_path: /prometheus/metrics
    static_configs:
      - targets: ['127.0.0.1:30120']
In order to make the server events gauge work, you need to add this line on top of already registered server scripts in fxmanifest.lua
Replace prometheus with whatever your prometheus resource name is.
server_script '@prometheus/eventHandler.lua'Refer to FiveM Natives - Get
--[[
 * @event prometheus:addMetric
 *
 * @param {string} type - The metric type, i.e. Gauge.
 * @param {string} name - The metric name.
 * @param {string} description - The metric description.
 * @param {function} cb - A callback function to update the metric with a method name (i.e. set) and a value.
]]
TriggerEvent("prometheus:addMetric", "Gauge", "fxs_gauge_example", "Gauge example.", function(cb)
    math.randomseed(os.clock())
    if math.random(0, 1) == 1 then
      cb("set", 42)
    else
      cb("set", 1664)
    end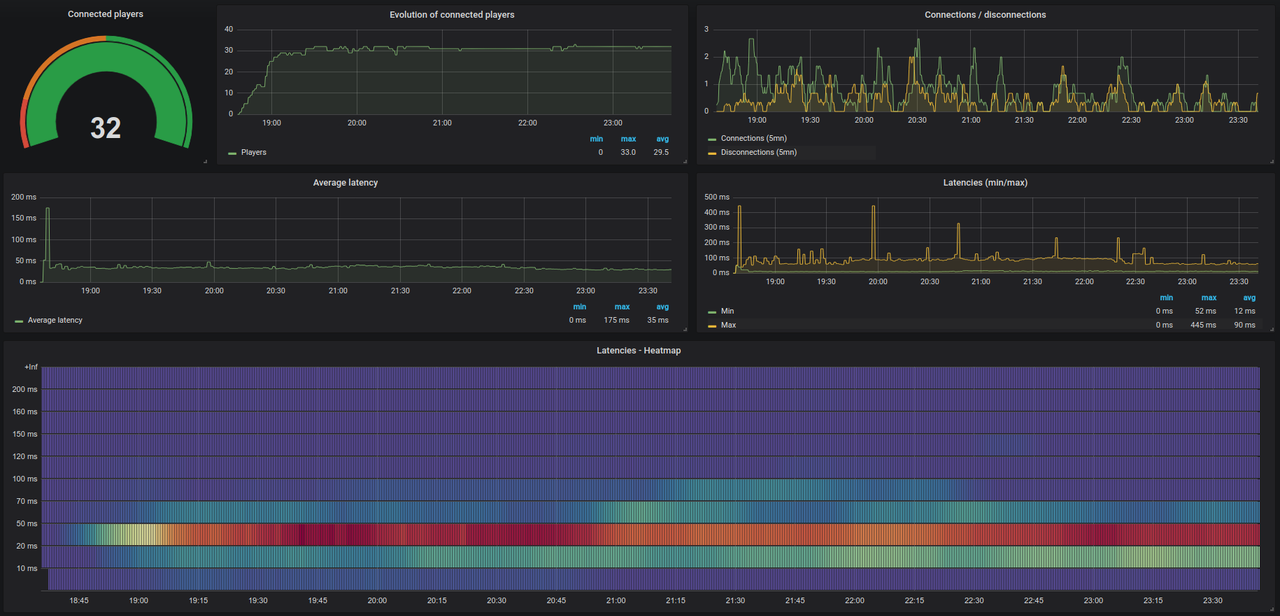
end)We supplied a grafanaDashboard.json including a example Grafana dashboard to use.
To use it refer to Grafana Documentation
Check the grafanaDashboard_new.json, this is a new dashboard version. (need to review some configurations)
On JSON file, look for the lines with 'instance=\"<YOUR SERVER IP>:30120\"' and replace by your server hostname/IP Address;