This repository was archived by the owner on Apr 9, 2025. It is now read-only.
Charts
Charts
The following charts use the following GoogleChartsXSLT file (unless otherwise specified) to draw the chart. The SqlViaXSLT module provides the required settings for what type of chart is displayed.
Check-in
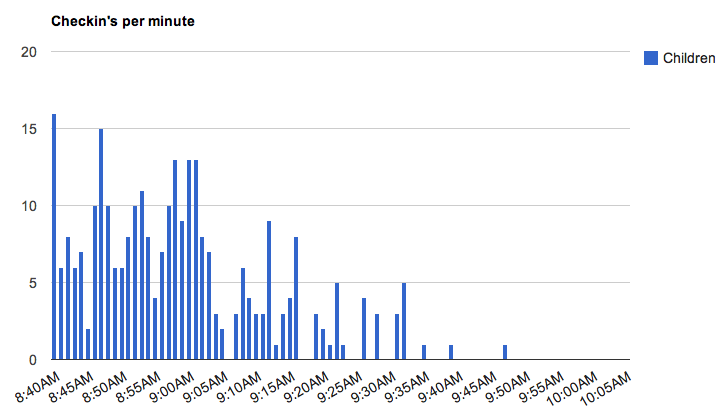
- Number of children checked-in per-minute. Cust_hdc_sp_getCheckinsPerMinute
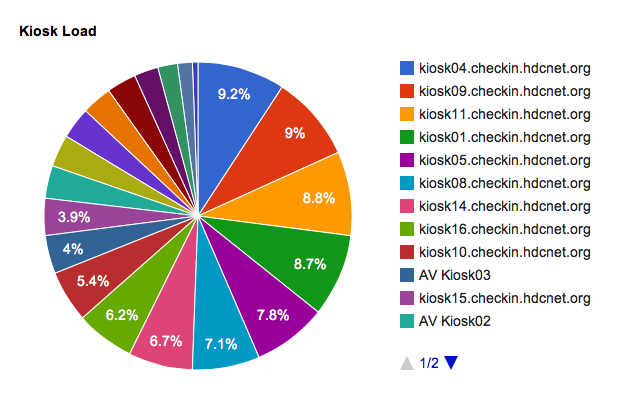
- Check-ins per kiosk for the previous weekend. Cust_hdc_sp_weekend_kiosk_stats
Attendance
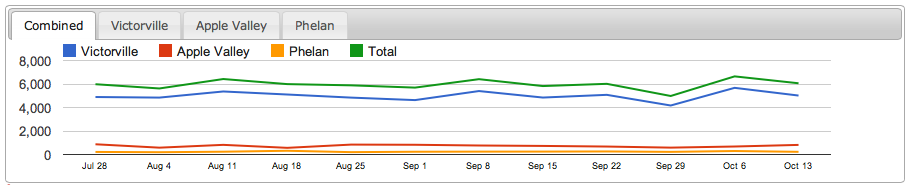
- Weekend attendance per campus. Cust_hdc_sp_weekendAttendanceStats Cust_hdc_sp_weekendAttendanceStats_XSLT
Administration
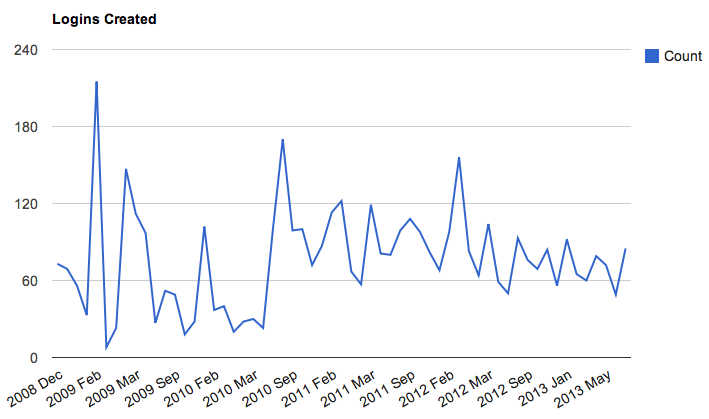
- Logins created by month. LoginsCreatedByMonth
- Exception History. ExceptionHistory
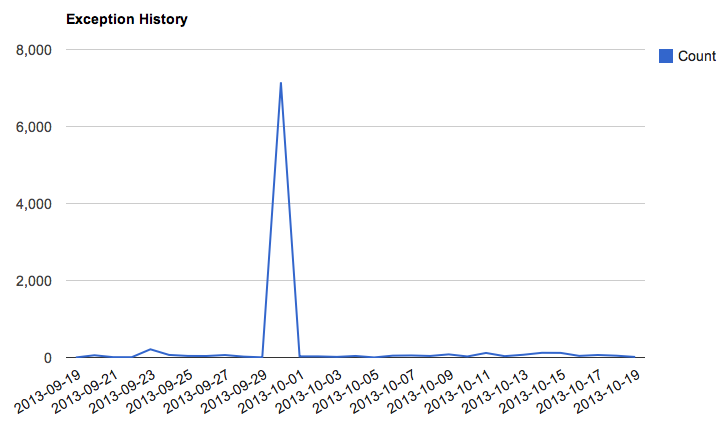
Yes, that chart is correct. Something happened on that day to cause 7,000 exceptions in the early morning. Looking at the logs it ended up being the monthly PCI security scan.