



HELIOS is a custom Home Assistant Lovelace card that turns your solar setup into a living 2.5D view of your home, the sun and the weather, all in real time and right inside your dashboard.
It reads your solar, grid and battery wiring straight from the Home Assistant Energy dashboard, pulls a multi-model weather forecast from Open-Meteo (no key), and stitches both onto a tilted, rotatable map of your home. The sun's daily arc, the live sun disc, the incidence ray, the production / battery / grid chips and the cast shadows all follow a timeline you can scrub days into the past or the future, watching every layer move with it.
The scene is drawn by a self-contained 2.5D engine with no WebGL: a tilted vector basemap with every overlay (buildings, shadows, sun arc, chips and leaders) projected on top in SVG, so the card stays light and fluid on any device, phone included. The basemap is Helios's own vector renderer built on OpenFreeMap (open data, no key), themed to match Home Assistant or fully customised per layer.
Website + live demo: explore the full card, the documentation and the public roadmap at helios-ha.org.
Helios is a single live 2.5D scene with a re-targetable timeline below it.
- Sun arc, the sun's full daily trajectory projected with depth onto your home. The below-horizon portion renders as discreet dots behind the home so it reads as a calm background, while the daylight portion, the sun disc and the irradiance readout always stack on top.
- Live sun disc + irradiance halo, pinned on the arc; the inner fill scales with the live W/m², a soft sun-coloured halo fades from the centre out.
- Incidence ray, a dashed line from the sun to the home, animated to flow faster the stronger the sun.
- Sunrise / sunset markers, placed where the arc crosses the horizon, with the local time (hidden in polar day / night where there is no crossing).
- PV production chip + leader + bead (when the solar source has a live power sensor), shows the measured instantaneous production; a bead rides the leader to the home at a speed proportional to current output.
- Battery chips (when a battery is configured), state of charge and signed instantaneous power, with a bead whose direction follows charge / discharge.
- Grid chip + leader + bead (when a grid source is configured), the active import / export flow, with a bead whose direction and speed track the power.
- Monitoring group chips (optional), bundle the devices tracked in your energy dashboard into up to four groups, each with its own name, colour and icon set in the editor. Every group gets a chip top-left with a leader to the home and a bead that flows with its consumption.
- Home pill, the hub the chip cluster orbits, showing the live home consumption balance (the energy dashboard's own definition) once every configured family has its live sensor. Click any chip (or the home) to point the timeline at that metric; the home takes the active chip's colour. Click that same chip again, once it is the active one, to raise its day curve.
- Cast ground shadows, projected from the surrounding building footprints, fading as the sun nears the horizon. Toggle and opacity are configurable.
- Day / night ground, the ground darkens where the sun is below the horizon, so dawn and dusk read at a glance.
- Hover glow + auto-rotation, a soft halo signals the home is interactive; an opt-in idle orbit slowly turns the scene counter to the sun's motion and pauses the moment you touch the card.
- Timeline, the active period as a re-targetable chart below the scene: production (with dashed forecast and per-source breakdown), consumption, grid and battery (each split per source when several are wired), battery SoC, irradiance (with the cloud layers overlaid) or any monitoring group. Click or drag to scrub; the whole scene snaps to the selected instant.
- Day curve, click any active chip a second time and the day you are scrubbing rises around the house as a line (or several), standing on the sun's own path projected down onto the ground. It is not a ring: the track closes in on the house at noon, when the sun is overhead, and reaches out to the arc's own feet at sunrise and sunset, so where a point sits on it IS the hour. Each metric draws itself its own way: production splits one stacked band per PV source in its dashboard colour, grid and battery split the same way (one band per source, import and export, charge and discharge, so a multi-meter grid or multi-pack battery reads each source; the battery keeps a dashed state-of-charge line per bank), a monitoring group draws one line per device, and irradiance draws one (except on Month, where the weather model does not reach). A dashed leader drops from the sun to the line beneath it, so the scrub reads the day at a glance, and today's remaining hours carry on from your solar forecast, dashed. Switch chips and the curve re-points and stays up; click the active chip again to put it away.
- Detail panels, tap any chip to open a compact readout top-right, tinted in that chip's colour: it aggregates the metric over the selected window as icon-only figures, all in your chosen unit. Production / consumption and each group show total, peak and per-day average; grid shows import, export and net; battery shows energy charged and discharged; battery SoC shows min / average / max; the sun shows peak and average irradiance plus the astronomy (sunrise, solar noon, sunset, max altitude, day length). Tap the scene background to close it.
- No UI mode (optional), fades the timeline and the on-card controls after a few seconds of inactivity and brings them back on any tap or move. Built for kiosks and wall displays.
- Sun-only card (optional), hide every chip (including home consumption) and the card collapses to just the sun position and your location, a solar-position card for a non-energy dashboard.
Helios follows your Home Assistant language, with 27 European languages bundled (any other language falls back to English).
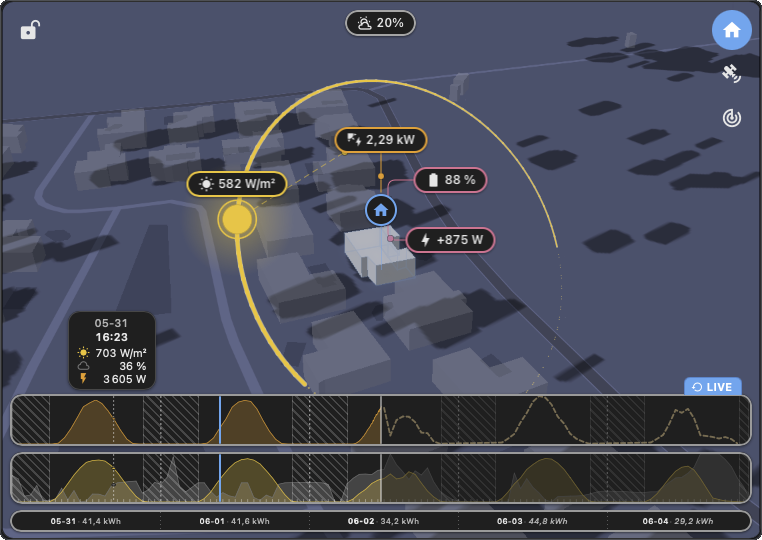
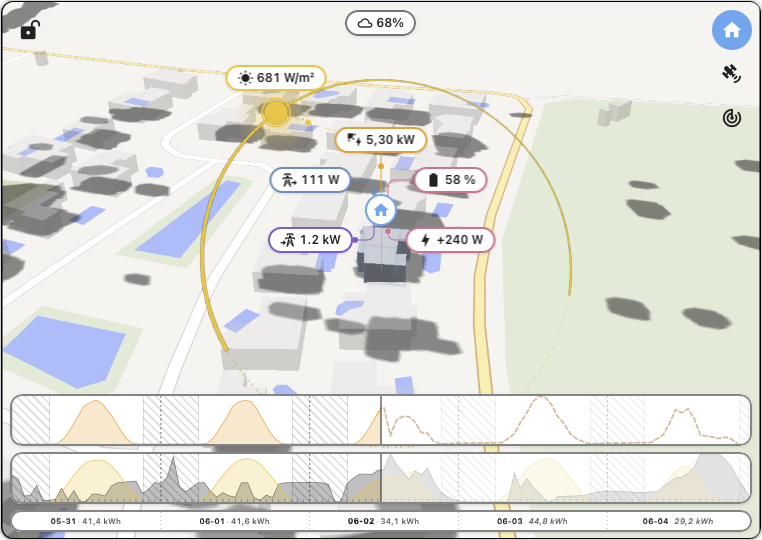
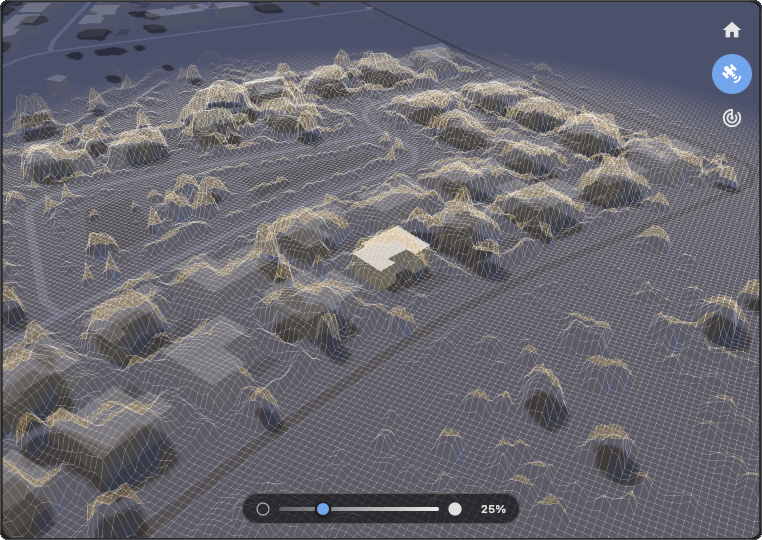
HELIOS displaying current solar exposure, cloud coverage and live PV production for the user's home. An interactive live demo is available at helios-ha.org.
Helios is built and maintained by one person, in the open. If it helps your daily routine, a star on GitHub or a small coffee keeps the project alive and lets me keep pushing on the next cycle. Upcoming work is tracked live on the public roadmap at helios-ha.org.

Helios is available directly in the HACS store.
- Open HACS.
- Search for HELIOS.
- Install it.
- Reload your browser.
- Add the card to your dashboard (see Adding the card to a dashboard).
- Download
helios.jsfrom the latest release. - Copy it to
<config>/www/community/helios/. - Add the resource to your dashboard:
url: /local/community/helios/helios.js
type: module
- Open the dashboard where you want the card and click the pencil icon (Edit dashboard) in the top right.
- Click + Add card.
- Search for Helios in the card picker and select it. Or scroll to the bottom, pick Manual, and paste:
type: custom:helios-card
- Save. Helios picks up your Energy dashboard configuration automatically, no other setup is required.
If Helios does not appear in the picker, the resource is probably not loaded. With a HACS install it is registered automatically. For a manual install, go to Settings then Dashboards, open the three-dot menu, choose Resources, and add the resource as described above, then hard-refresh your browser.
No API key required. The basemap is rendered in-house from OpenFreeMap vector tiles (open data, no key) and weather comes from Open-Meteo (also free, no key).
Solar, grid and battery wiring is not configured per-card: Helios resolves every entity slot from the HA Energy dashboard (Settings then Dashboards then Energy), the same global config the official Energy card reads. Set the slots there once and Helios picks them up automatically. The options below cover only the visual and install-specific bits.
Helios follows the energy dashboard at 100% and never estimates a value:
- Live chips (real-time values in the scene) read the live power sensors of your energy dashboard sources: the optional "power" field of each source. If a source has no live power sensor, its chip is simply not shown, and the editor's live-data panel tells you what to add. Nothing is ever derived from cumulative meters to fake a "now" value.
- Curves, scrub and totals read your kWh meters through the recorder statistics, the exact data the energy dashboard's bars are made of. Where the dashboard has a number, Helios shows the same number.
- Home consumption is the dashboard's own balance (solar + import - export
- battery), computed live from the live sensors, shown once every configured family has one.
- If the grid's live sensor is detected as mis-wired (for example an import-only sensor configured as a signed net sensor), Helios hides the grid chips and the editor explains what to fix, instead of showing values that cannot be trusted.
So: a visible chip is always a real-time measurement; a curve is always your official meter data. If a chip you expect is missing, open the editor: the live-data panel lists, family by family, what your dashboard provides and what is missing.
Minimal config:
type: custom:helios-cardThe visual editor exposes every option below. Direct YAML editing also works.
| Key | Type | Default | Description |
|---|---|---|---|
home-latitude |
number | HA home | Optional override (decimal degrees). Applied only when both lat and lon are set and valid; otherwise the card uses hass.config. Useful for a holiday home, a shared install, or several cards each centred on a different place. |
home-longitude |
number | HA home | Companion to home-latitude. Partial or out-of-range values are ignored. |
| Key | Type | Default | Description |
|---|---|---|---|
auto-rotate-enabled |
boolean | false |
Idle camera orbit. Off by default; enable for kiosk / always-on dashboards. Any drag pauses it, then it resumes after a short idle. |
camera-pitch-deg |
15-85 | 55 |
Optional fixed pitch at boot. Drag still works unless locked. |
camera-bearing-deg |
0-359 | hemisphere | Optional fixed bearing at boot. |
camera-locked |
boolean | false |
Disable drag-rotate and the idle orbit; the camera stays at the configured pose. Also toggled live from the lock button on the card. |
The card also remembers the live camera pose, the selected period, the selected chip and the lock per home (or per
cache-id), so reopening the dashboard restores exactly what you left.
| Key | Type | Default | Description |
|---|---|---|---|
auto-hide-ui |
boolean | false |
No UI mode: fade the timeline and the on-card controls after a few seconds of inactivity, bringing them back on any tap or move. For kiosks and wall displays. |
| Key | Type | Default | Description |
|---|---|---|---|
display-radius |
0-250 m | 200 |
Distance around the home within which buildings and shadows render. The main perf lever on older phones. 250 m is as far as the ground under them reaches; 0 draws none. |
building-count |
10-100 | 50 |
How many of the nearest buildings to keep around the home. |
building-real-size |
boolean | true |
Extrude buildings to their real OSM heights (capped). When false, every building uses the fixed building-height prism. |
building-height |
3-10 m | 6 |
Fixed prism height used when building-real-size is false. |
building-cluster-radius |
0-100 m | 0 |
Buildings within this distance of the home (or touching it) join the home group at full opacity. Use it to attach garages / verandas to the house. |
building-opacity |
0-1 | 0.5 |
Opacity of the surrounding buildings. The home (and its cluster) always stays at full opacity. |
building-color |
color | theme | Optional base tone for the surrounding buildings. |
shadows-enabled |
boolean | true |
Master toggle for the cast ground shadows (projected from the building footprints). |
shadow-opacity |
0-1 | 0.32 |
Opacity of the cast shadows. |
| Key | Type | Default | Description |
|---|---|---|---|
display-update-frequency-per-hour |
1-6 | 4 |
Storage + render cadence (buckets per hour) for the data store, every graph and the day curve's own resolution. 4 = 15-minute granularity (the HA Energy bucket size); raise for smoother curves, lower to save memory. Live numeric chips bypass this and stay on the direct hass.states path. |
value-decimals |
0-3 | 1 |
Decimal places on every kW / kWh / % readout. |
power-unit |
W | kW |
kW |
Unit for every power readout (chips, tooltips). Energy follows it, so kW pairs with kWh and W with Wh. |
irradiance-unit |
W/m² | kW/m² |
W/m² |
Unit for the solar-constant (irradiance) readout above the sun. |
battery-sign |
default | inverted | hidden |
default |
Sign shown on the battery chip: default (minus charging, plus discharging), inverted, or hidden (magnitude only). Display-only; flows and history are unchanged. |
The rolling window itself is chosen live from the timeline's period selector (Forecast, Yesterday, Today, Week, Month) and remembered per card; it needs no YAML key.
| Key | Type | Default | Description |
|---|---|---|---|
solar-irradiance-entity |
entity_id | none | Optional physical irradiance sensor (W/m²). When set, its live state + recorder history feed the sun chip number, the irradiance chart and the sun-arc colouring for past + present; forecast hours still come from Open-Meteo. |
monitoring-group-names |
map | none | Per-group display name (group number -> name). Set from the editor's monitoring-group section. |
monitoring-group-colors |
map | --graph-color-N |
Per-group colour (group number -> colour). Falls back to Home Assistant's graph colour for that group. |
monitoring-group-icons |
map | none | Per-group icon (group number -> MDI icon). With no icon the group shows its number. |
hidden-devices |
list | none | Device meters hidden from every view. Managed from the editor's device list (the eye toggle). |
home-color |
color | theme | Optional colour for the home pill and its consumption readout. |
| Key | Type | Default | Description |
|---|---|---|---|
cache-id |
string | auto | A hidden, auto-generated id that keeps each card's saved view (selected period, selected chip, camera, lock) independent, so two cards on the same home do not share state. You normally never touch this. |
- Solar position, a compact declination + equation-of-time model with hour-angle normalisation so longitudes far from Greenwich stay correct, validated against the NOAA reference.
- Clear-sky GHI, Haurwitz (1945),
1098 * cos(z) * exp(-0.059 / cos(z))W/m², attenuated by cloud via Kasten-Czeplak (1980). - Effective cloud cover, Helios replaces Open-Meteo's raw total
cloud_coverwithlow + 0.6*mid + 0.2*high(capped at 100 %), which matches ground perception and shortwave attenuation better. - Multi-model weather, every fetch fuses a global model (ECMWF IFS) with the most accurate regional model for your location, taking the per-timestep median so a single-model outlier cannot skew the curve. Cached in the browser, with exponential back-off on rate limits.
- Energy from the HA Energy dashboard, the single source of truth for every solar / grid / battery number. Live chips read the configured rate sensors (or differentiate a cumulative meter to watts); the timeline's past curves read the recorder's pre-computed
changemetric, the exact numbers the official Energy dashboard shows, so the two surfaces agree to the watt-hour. - PV forecast, read natively from the HA Energy dashboard's configured solar-forecast provider and drawn as the dashed prediction the live observation tracks against; scrubbing into the future flips the PV chip to the predicted figure.
- Buildings, fetched once from OpenStreetMap (via OpenFreeMap vector tiles), interpreted in the browser (height cap or fixed prism, radius / count / cluster filters) and cached locally, so the scene spins up offline on the next load.
Full algorithm + architecture details: see ARCHITECTURE.md. Per-release notes: see CHANGELOG.md.
| Component | Technology |
|---|---|
| Frontend | Lit 3, TypeScript (strict) |
| Rendering | Self-contained 2.5D engine: tilted vector basemap (HTML canvas) + SVG overlays, no WebGL |
| Basemap | OpenFreeMap vector tiles, rendered in-house (Auto / Dark / Light / Custom, no key) |
| Weather data | Open-Meteo API (free, no key, multi-model fusion) |
| Energy data | Home Assistant Energy dashboard (recorder change metric + live states) |
| Buildings | OpenStreetMap via OpenFreeMap vector tiles, merged with polygon-clipping |
| Solar math | NOAA-validated |
| Build | Vite |
npm install
npm run dev        # local dev server
npm run typecheck  # strict TS
npm run build      # produces dist/helios.js
The card is TypeScript-first and fully self-contained, a single helios.js bundle whose only runtime dependencies are Lit and polygon-clipping, both bundled in.
Source layout:
| Path | Purpose |
|---|---|
src/helios-card.ts |
Top-level Lit element: render orchestrator + HA + Lit lifecycle |
src/core/config/helios-config.ts |
HeliosConfig schema + resolver helpers (radius, monitoring groups, colours, ...) |
src/core/config/constants.ts |
Defaults / bounds, cache TTLs, camera limits, colour + math constants |
src/core/format/format.ts |
Locale-aware number / value formatting + energy colour tokens |
src/core/time/ |
Solar position (sun.ts), day / night fraction (sun-zones.ts), home-timezone maths (timezone.ts) |
src/core/render-kit/ |
Shared drawing kit: hex blending + tints (colors.ts / hex.ts), projection geometry (geometry.ts) |
src/core/i18n/ |
Strict-typed translations (index.ts + locales/, 27 languages) |
src/core/energy.ts |
Home-consumption balance (the energy dashboard's definition) |
src/scene/helios-engine.ts |
Engine lifecycle: weather / buildings fetch, sun + shadow refresh, camera + auto-rotate |
src/scene/renderer.ts |
Scene painter: ground tilt + buildings + shadows, graded through the day/night cycle (canvas + SVG) |
src/scene/projection.ts |
2.5D camera + bearing / pitch / perspective projection |
src/scene/ground-render.ts ground-vector.ts tiles.ts |
Vector ground renderer (OpenFreeMap layers, themeable) + Web Mercator math |
src/scene/buildings.ts openfreemap.ts vector-tile.ts |
OpenFreeMap fetch + interpret (radius / count / height / cluster) |
src/scene/sun-arc.ts |
Sun-arc + irradiance geometry (Haurwitz / Kasten-Czeplak, PV math) |
src/scene/day-curve.ts |
Day curve geometry: the shared sun ground track, per-strand splines, the depth split, risers and beads |
src/scene/helios-logo.ts hud-layout.ts |
Flat Helios mark + chip-cluster layout |
src/hud/scene-hud-controller.ts hud.ts hud-geometry.ts |
Scene HUD projection (sun arc, chips, leaders) refreshed each frame |
src/hud/detail-panel.ts |
Per-chip detail panel: window aggregates (total / peak / avg, astro) as icon rows |
src/data/unifiedStore.ts |
Rolling-window data store: one bucketised source of truth for every graph |
src/data/period-totals/ |
Hour-of-day aggregation: the detail panel's period totals + the day curve's one-day profile |
src/data/source-fetch.ts series-sample.ts request-cache.ts durable-cache.ts ha-gateway.ts |
Fetch orchestration, sampling, and caching layers |
src/data/energy-forecast.ts |
HA solar-forecast fetch + merge |
src/data/weather.ts weather-resolve.ts |
Open-Meteo multi-model fetch + cache + back-off (cloud, irradiance) |
src/data/sources/energy-prefs.ts |
HA Energy dashboard subscription + slot resolution (PV / grid / battery / forecast) |
src/data/sources/energy-stats.ts |
Recorder change-metric helpers (buckets to watts) |
src/data/sources/pv.ts battery.ts grid.ts |
Per-source live + history (power, SoC, import / export) |
src/data/sources/irradiance.ts |
Optional irradiance-sensor override into the engine |
src/data/sources/device-consumption.ts |
Per-device meters + monitoring-group membership / colours |
src/charts/charts.ts charts-pv.ts charts-generic.ts |
Timeline SVG charts + scrub cursors + day labels + tooltip |
src/timeline/timeline.ts timeline-model.ts timeline-modes.ts |
Scrub handlers, tick granularity, the rolling-window periods |
src/timeline/timeline-overlays.ts timeline-tooltip.ts |
Timeline night-zone / future-mask shading + hover tooltip |
src/editor/editor.ts |
Visual editor (accordion sections, sliders, entity / icon / colour pickers, group setup) |
src/css/ |
Card + editor + timeline style literals |
See ARCHITECTURE.md for the subsystem-by-subsystem walkthrough.
HELIOS depends on several open data services. None require an account or API key.
- OpenFreeMap, the free vector basemap tiles (open data, no key) the scene's ground is rendered from.
- OpenStreetMap, the map data behind the basemap and the building footprints (served as vector tiles by OpenFreeMap). © OpenStreetMap contributors.
- Open-Meteo, weather forecasts (cloud cover, irradiance). Free, no key, multi-model fusion under the hood.
- Home Assistant Energy dashboard, the single source of truth for solar / grid / battery wiring.
Bundled into helios.js alongside Lit:
- polygon-clipping by Mike Fogel (MIT), the boolean polygon operations behind merging touching buildings of equal height into a single block.
A heartfelt thank you to every user who tried Helios, filed an issue, suggested an idea or simply shared a screenshot. Your feedback is what shaped the direction the card has taken.
I build bridges between data and reality. To me, development is more than a profession; it is the tool I have used since childhood to try and decode the complexity of the world around me. I learn every day, fully aware that total understanding is an infinite horizon I will likely never reach, but the journey is worth it.
HELIOS, solar conditions visualisation card for Home Assistant. Copyright (C) 2026 Jérôme CREMOUX (ReikanYsora).
This project is licensed under the GNU General Public License v3.0, see the LICENSE file for details.
