This program is meant to provide a lot of different features related to the Mandelbrot set. The wikipedia page of the Mandelbrot set gives a very good explanation of what it is and the basic idea of how to plot it.
- Explore the Mandelbrot set
- You can change the colormap (see below)
- You can change the kernel used to render it (see below)
- You can dynamically see and modify your coordinates and the level of zoom
- Generate videos of zoom into the Mandelbrot Set
- Generate single images of zooms into the Mandelbrot set
To define the Mandelbrot set, we first define for each complex number c the sequence zn+1=zn2+c with z0=0. The complex number c is said to belong to the Mandelbrot set if and only if this sequence is bounded.
Another way to say it is that you take a complex number c that will remain constant, then you define a variable z with an initial value of zero and you iterate z=z2+c. If z gets bigger and bigger indefinitely, c does not belong to the Mandelbrot k.
However in order to programmatically find if a point belongs to the set, we do not need to iterate indefinitely because of a theorem that proves that if |z|>2 then the sequence will always diverge Therefore, we only need to iterate the sequence until |z|>2 to be sure that a number is outsie of the Mandelbrot set. We consider that a number is inside of the Mandelbrot set if |z|<2 after a sufficiently large number of iterations.
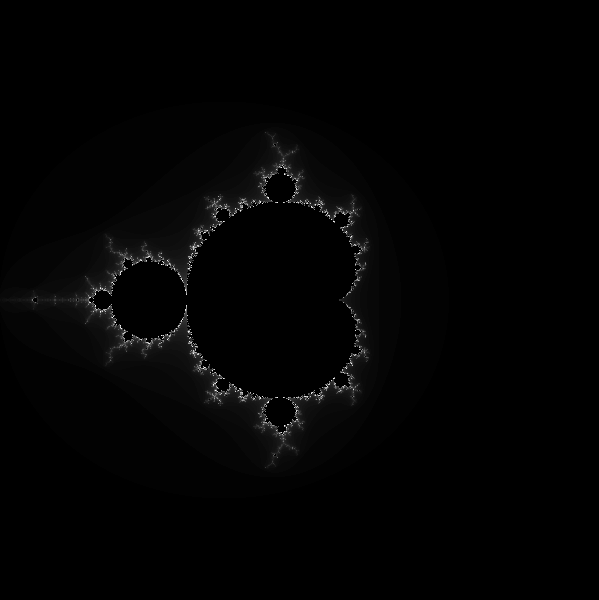
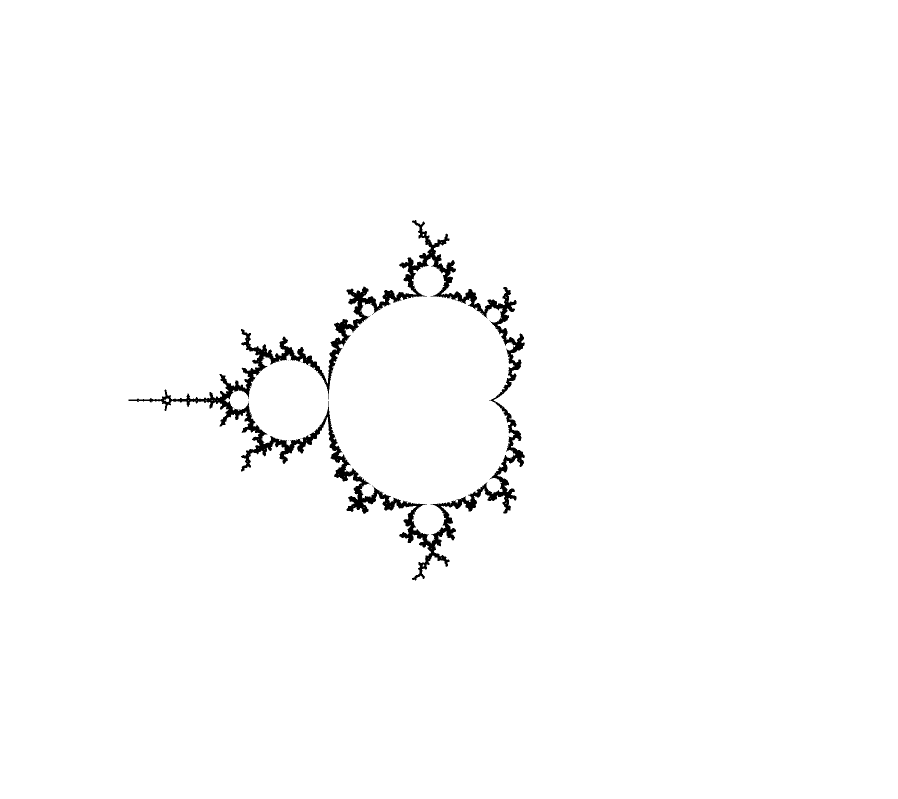
We can "plot" the Mandelbrot set by coloring each point of a plane one color if its affix is in the Mandelbrot set, and another color if if the point is outside the Mandelbrot set. Here is the image we get after coloring in white points whose affix belong to the set in white and points whose affix don't belong to the set in black:

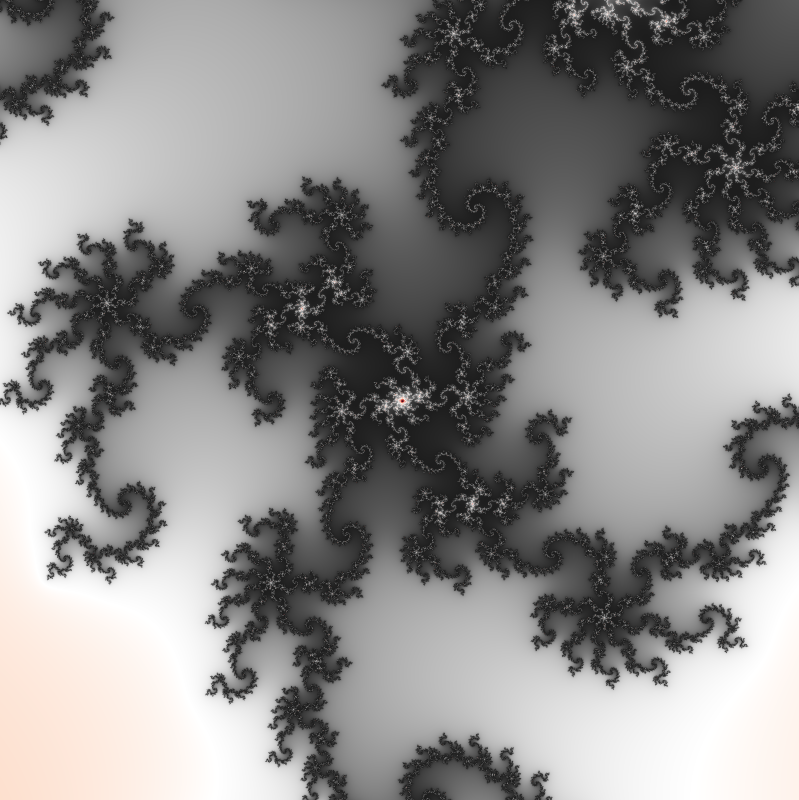
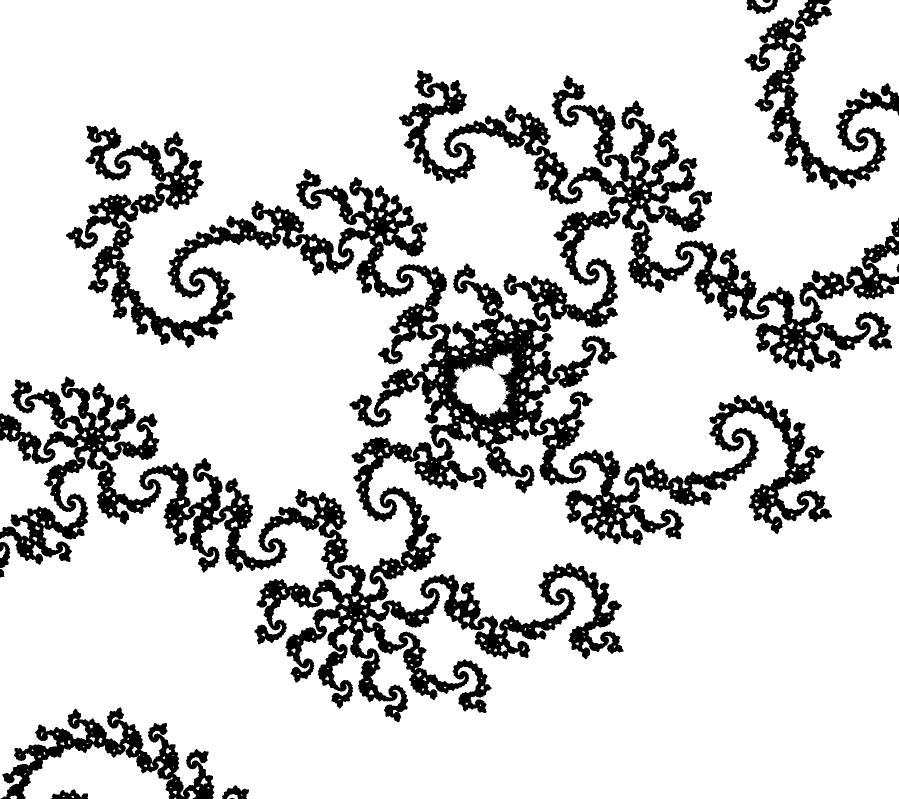
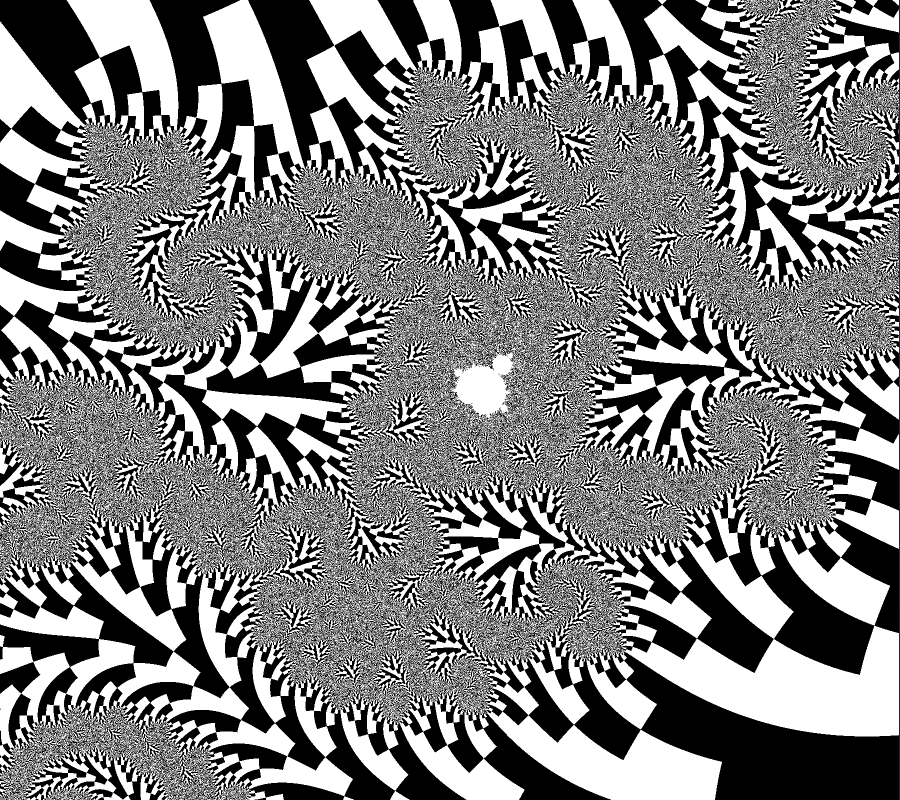
The result is a bit strange but we can notice something zooming around the boundaries of the set: it has an unlimited level of details. For example, here is an image of a zoom around the point (-0.135; 0.75):

This is because the Mandelbrot set is a fractal.
The "explore" feature of this program lets you zoom in different places of the Mandelbrot set, to discover all the details of its boundaries.
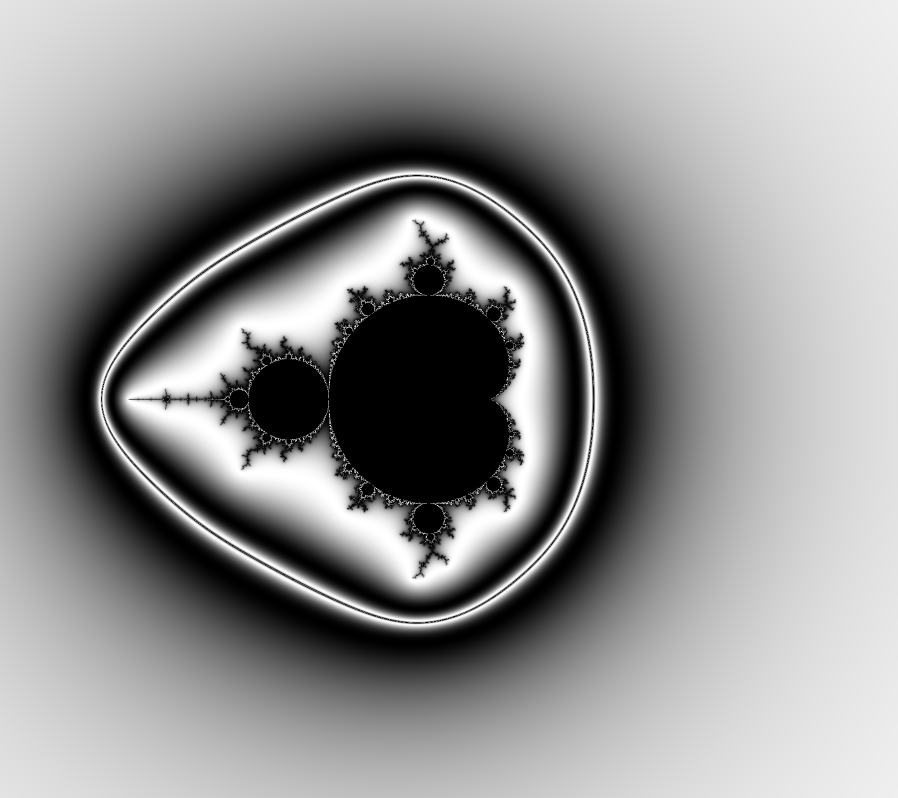
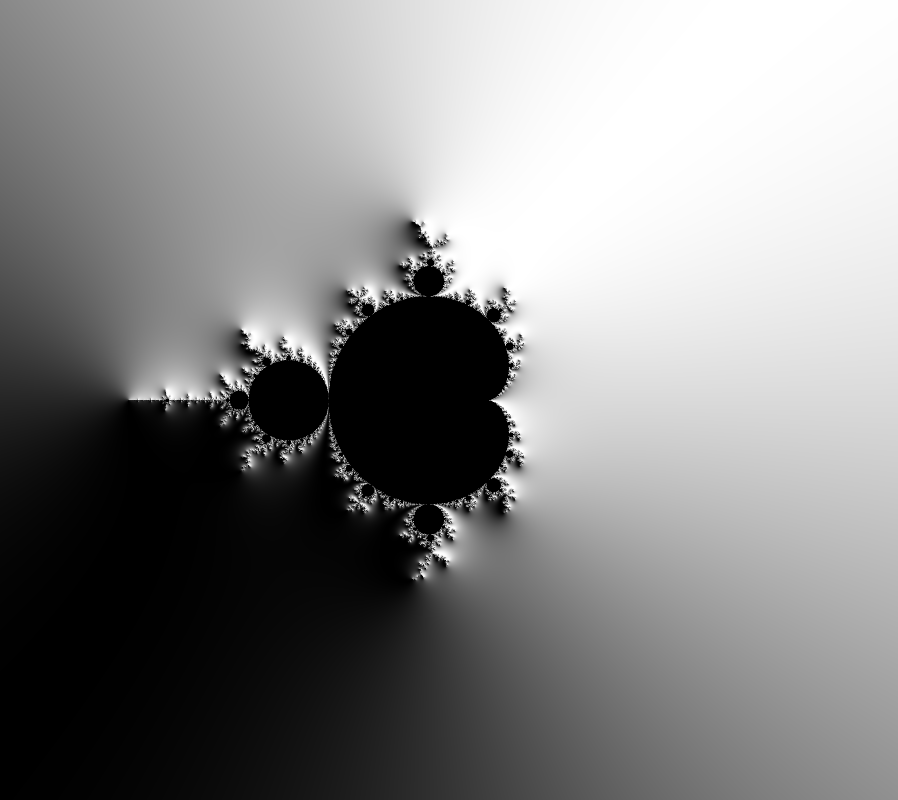
Many parts of the Mandelbrot set are "infinitely thin" (they have a width of zero). In an image colored as described before, you can't see these parts at all. In order to see them more clearly, it would be nice to have a way to color points outside of the set to vaguely indicate how close they are to the set. There are many ways to do it, the easiest is to count after how many iterations |z|>2, which means after how many iterations it takes to discover that the point is outside the set. Then you can use this value to color the point in grayscale, for example you can divide this value by the maximum number of iterations you chose and set an RGB color accordingly. Here is how it looks with 100 iterations:
It already looks much nicer than the previous images, but this algorithm has some downsides: the look of the image will change a lot depending of your number of iterations, and there is a kind of aliasing because you can only have a whole number of iterations.
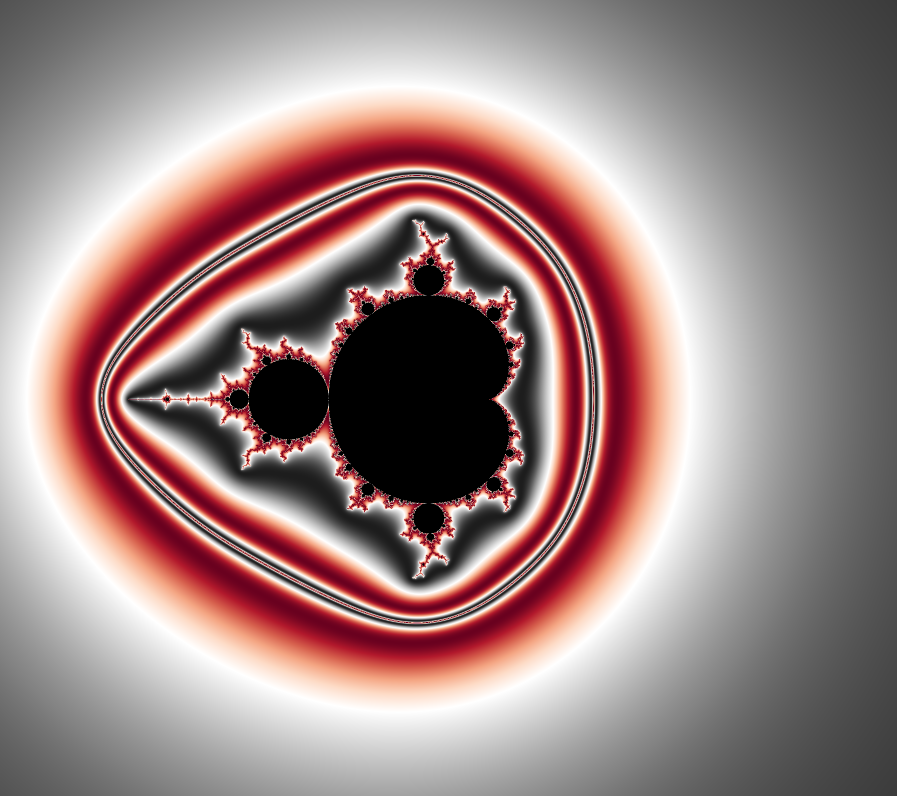
If you prefer colors to black and white, you can apply a "colormap", which means mapping numbers between 0 and 1 to colors in the RGB space.
To render the Mandelbrot set, this program uses two GLSL shaders:
- The "kernel", that makes the main computation for each pixel and outputs a value between zero and one. That's where the kind of algorithms described above to color the outside of the set may be implemented. The kernel can be changed at any time while the program is running. A few kernels are included in the /kernels folder, but you can also create your own. Most of the algorithms used in the kernels that I made come either from there or from there.
- The "colormap" shader. It contains a functions "colormap" that takes a float between 0 and 1 as input and outputs a vec4 corresponding to an RGBA color. One is included in the /colormaps folder, but kbinani made over one hundred other ones downloadable here (I made the program to be compatible with them).
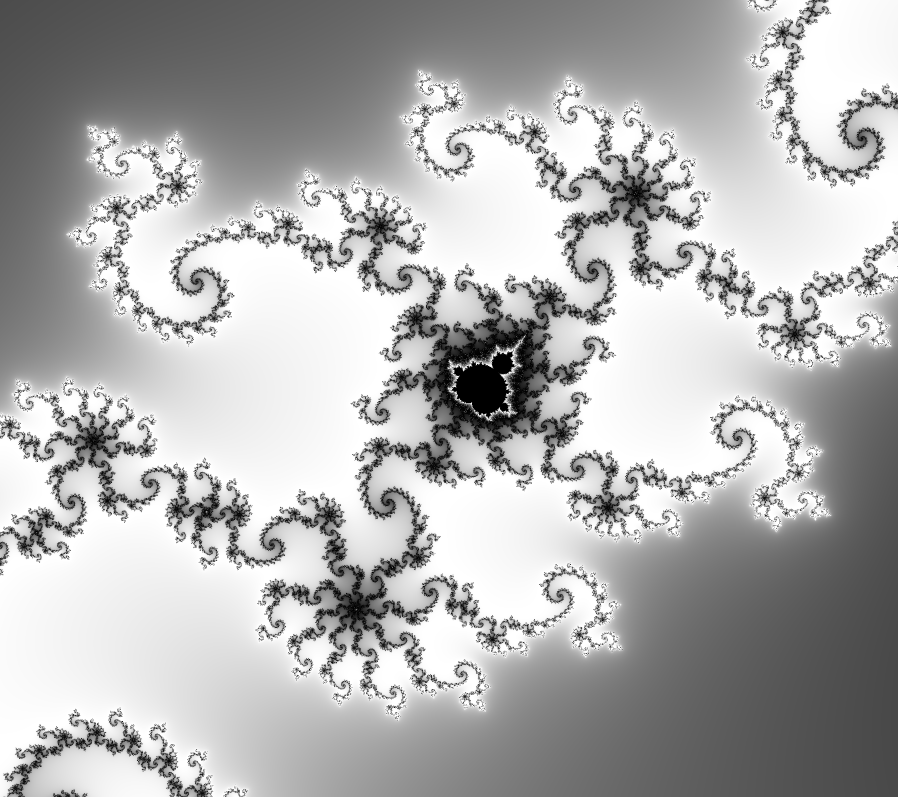
Rendered with the default kernel, colorFrequency=1.5
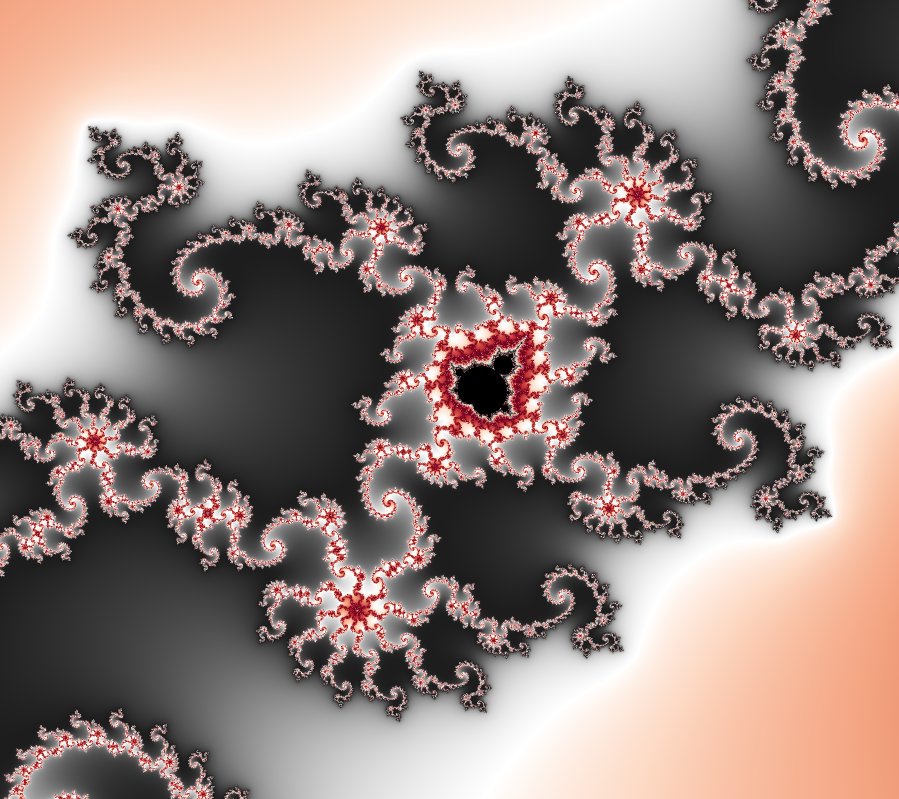
Rendered with the default kernel and the IDL_CB-RdGy colormap, colorFrequency=1.5
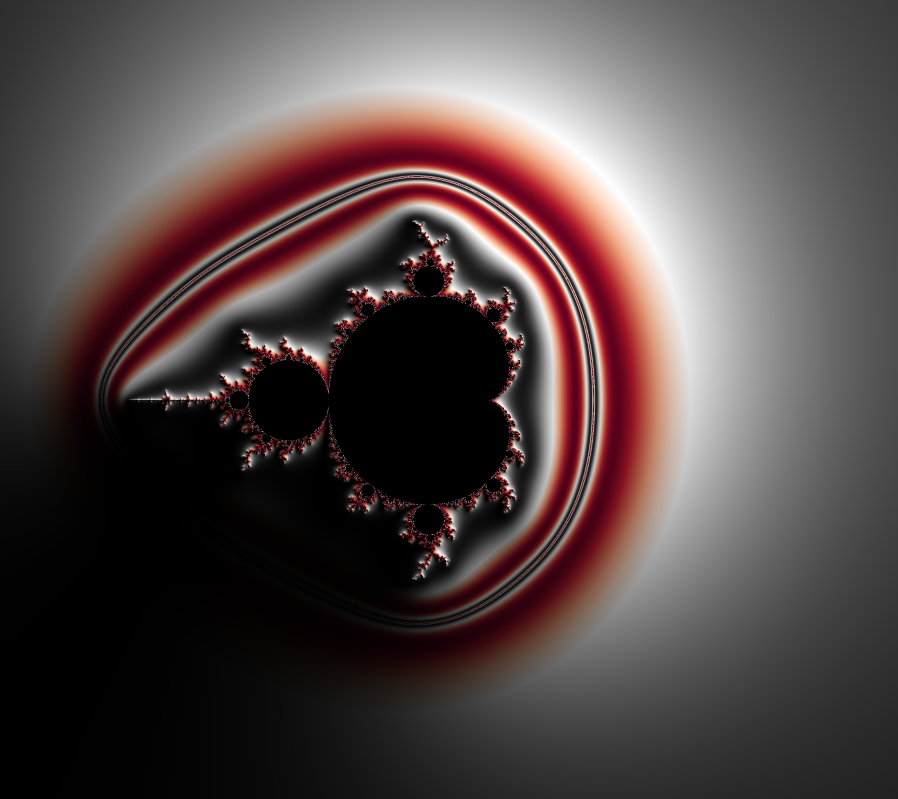
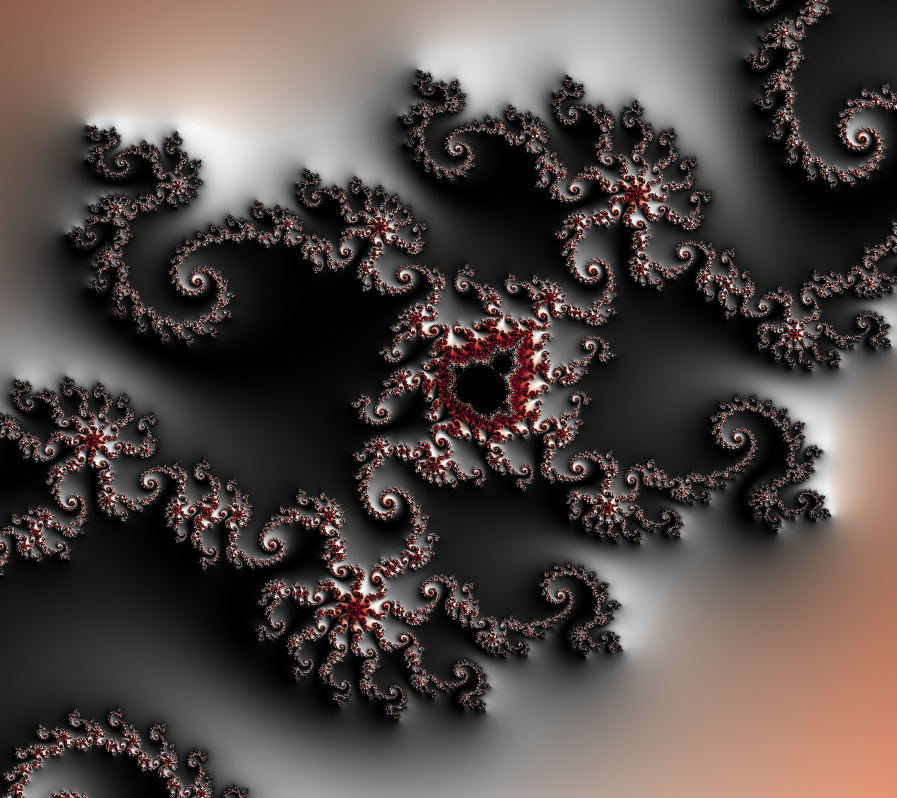
Rendered with the colored normal map kernel and the IDL_CB-RdGy colormap, colorFrequency=1.5
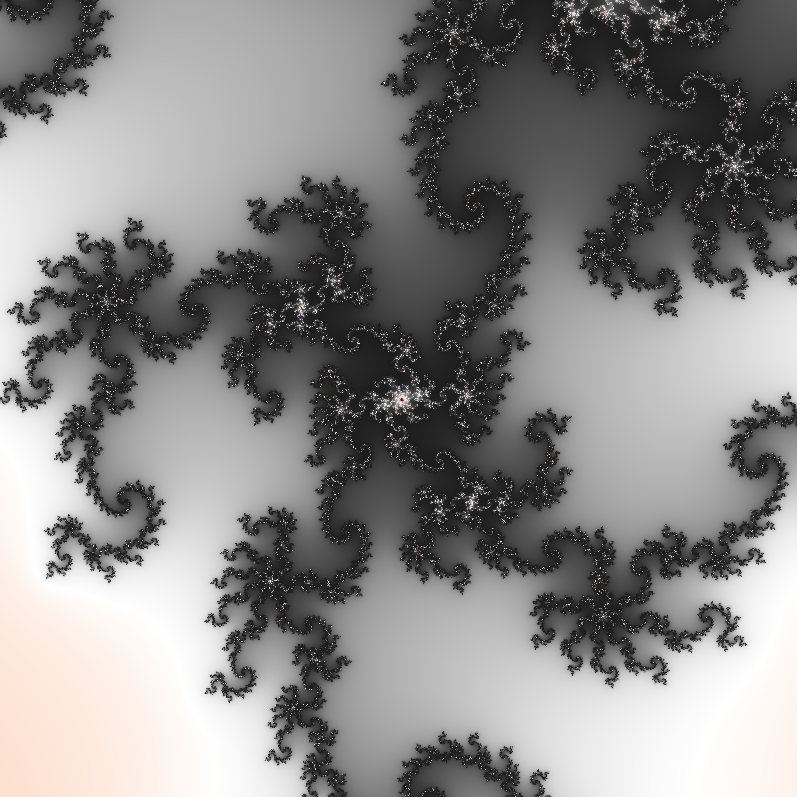
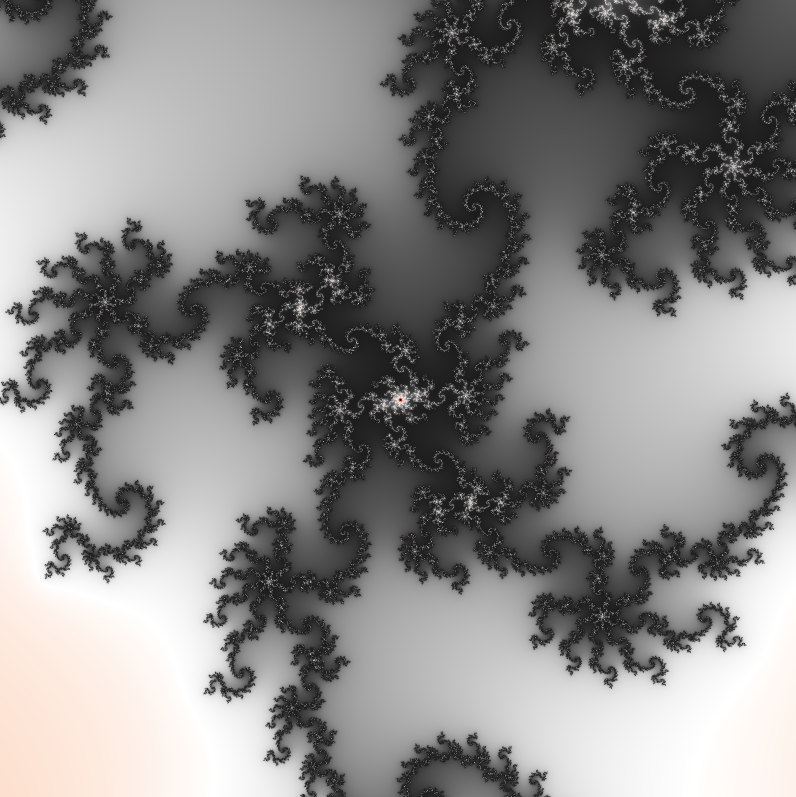
Rendered with the normal map kernel
Rendered with the distance estimator kernel
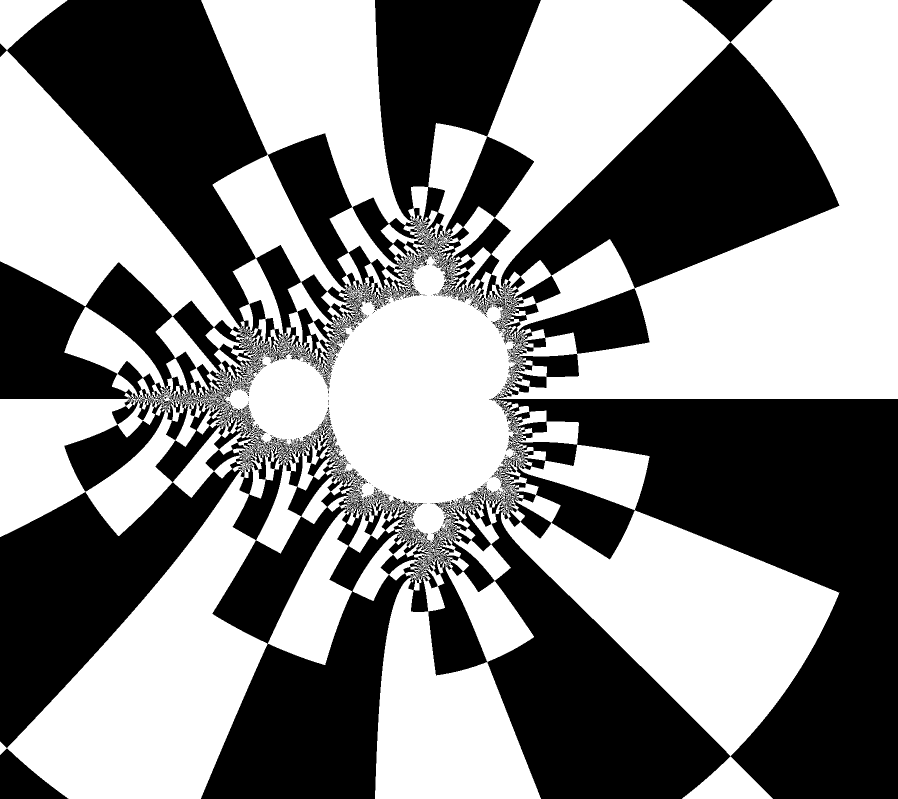
Rendered with the external rays kernel
Rendered with the default kernel, colorFrequency=3.6
Rendered with the default kernel and the IDL_CB-RdGy colormap, colorFrequency=3.6
Rendered with the normal map kernel

Rendered with the colored normal map kernel and the IDL_CB-RdGy colormap, colorFrequency=3.6
Rendered with the distance estimator kernel
Rendered with the external rays kernel
centered on (-0.834023157993864; 0.231587601463592), zoom=67617, 1000 iterations, default kernel, IDL_CB-RdGy colormap, colorFrequency=3.0
quality = 1
quality = 2
quality = 3