Home
This library is written in Visual Studio 2019 VB.net, you can include this library in your project to draw using logical coordinates instead of physical coordinates .
The commands available with VBPlotter are partly inspired by graphical commands used in HP's Rocky Mountain BASIC language, specialized in measuring instruments management via the IEEE 488 interface bus (HP-IB), distribution of RMB is no longer available.
Graphic commands available in RMB allowed to create scientific graphs quickly without having to get lost in complicated topographical transformations to manage graphic display, remember that in VB.net the axes origin in a PictureBox is located at the top left and all commands to draw points and lines they use physical coordinates thus complicating the representation of a graph
Here a sample picture generated with VBPlotter lib:

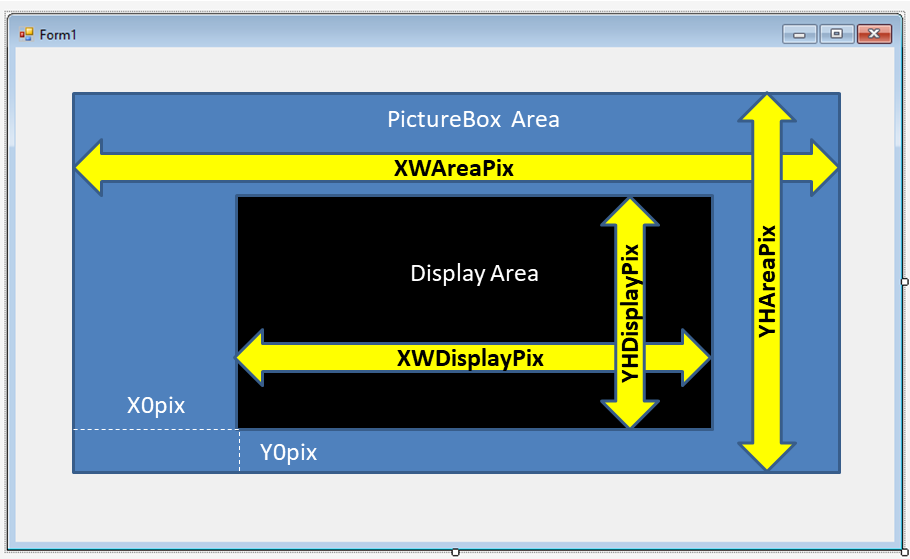
Below the diagram of coordinate system of the library, note that the origin of the axes of the PictureBox Area is positioned bottom/left instead of top/left as expected by the PictureBox object, in this way assignment of origin is more easy as well as assignment of logical scale.
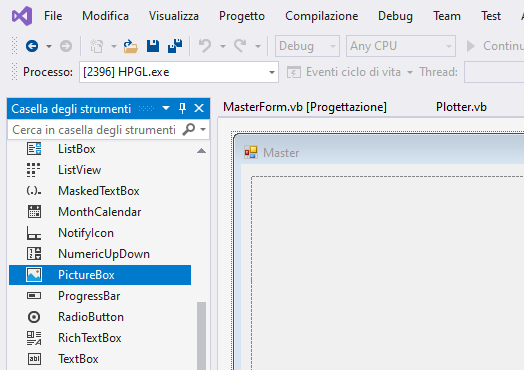
To use library you first need to include a PictureBox in your form:
Then use the commad SetDisplayPhysicalArea to define:
- physical size of PictureBox
- physical position of bootom/left corner of plotter area into PictureBox
- physical dimension of plotter area
SetDisplayPhysicalArea(VpicGraph As PictureBox, XWAreaPix As Single, YHAreaPix As Single, X0pix As Single, Y0pix As Single, XWDisplayPix As Single, YHDisplayPix As Single)
- VpicGraph name of used PictureBox
- XWAreaPix Horizontal physical dimension of PictureBox (number of pixel)
- YHAreaPix Vertical physical dimension of PictureBox (number of pixel)
- X0pix Physical position of left/bottom corner of plotter area
- Y0pix Physical position of left/bottom corner of plotter area
- XWDisplayPix Horizontal physical dimension of plotter area (number of pixel)
- YHDisplayPix Vertical physical dimension of plotter area (number of pixel)
After defined physical area you have to define logical coordinate using scale command:
SetScale(XL As Single, XR As Single, YB As Single, YT As Single)
- XL (XLeft) Minimum logical value of X
- XR (XRight) Maximum logical value of X
- YB (YBottom) Minimum logical value of Y
- YT (YTop) Maximum logical value of Y
To bind plotter library to PictureBox follow these step:
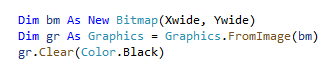
with Frame command you can draw a frame around the display area:
Frame(gr As Graphics, P As Pen)
- gr Pointer to display
- P Defined color Pen
You can draw axes passing through a defined origin and specify also a minor mark reference
Axes(gr As Graphics, P As Pen, XCenter As Single, YCenter As Single, Optional Xmark As Single = 0, Optional Ymark As Single = 0)
- gr Pointer to display
- P Defined color Pen
- XCenter Origin for X axis
- YCenter Origin for Y axis
- Optional Xmark Minor X mark spacing
- Optional Ymark Minor Y mark spacing
To better read graph we can use GRID command to draw X and Y reference lines
Grid(gr As Graphics, P As Pen, XCenter As Single, YCenter As Single, Xstep As Single, Ystep As Single)
- gr Pointer to display
- P Defined color Pen
- XCenter Origin for X axis
- YCenter Origin for Y axis
- Xstep Distance between two X grid lines
- Ystep Distance between two Y grid lines
A title can be easily added to graph with Graph Title command
GraphTitle(gr As Graphics, Title As String, Font As String, Size As Single)
- gr Pointer to display
- Title Title of the graph
- Font Font for title
- Size Size of title
same way for X axis title
XTitle(gr As Graphics, Title As String, Font As String, Size As Single)
- gr Pointer to display
- Title Title of the graph
- Font Font for title
- Size Size of title
same way for Y axis title
YTitle(gr As Graphics, Title As String, Font As String, Size As Single)
- gr Pointer to display
- Title Title of the graph
- Font Font for title
- Size Size of title
a number near vertical grid on X axis can be placed with command XmarkLabel :
XmarkLabel(gr As Graphics, XCenter As Single, MarkStep As Single, Font As String, Size As Single)
- gr Pointer to display
- XCenter Origin of Xgrid
- MarkStep logical distance between two vertical lines
- Font Font for title
- Size Size of title
a number near horizontal grid on Y axis can be placed with command YmarkLabel :
YmarkLabel(gr As Graphics, Ycenter As Single, MarkStep As Single, Font As String, Size As Single)
- gr Pointer to display
- YCenter Origin of Ygrid
- MarkStep logical distance between two horizontal lines
- Font Font for title
- Size Size of title
now all is ready to draw lines or plot point with draw and plot command:
Draw(gr As Graphics, P As Pen, x1 As Single, y1 As Single, x2 As Single, y2 As Single)
- gr Pointer to display
- P Defined color Pen
- X1 X1 point
- Y1 Y1 point
- X2 X2 point
- Y2 Y2 point
Plot(gr As Graphics, C As Color, x1 As Single, y1 As Single)
- gr Pointer to display
- C Defined color
- X1 X1 point
- Y1 Y1 point
Plot and Draw command include a routine to crop value outside the logical area
DrawLogicRect allow you to draw rectangle in logical coordinates:
DrawLogicRect(gr As Graphics, C As Color, RX0 As Single, RY0 As Single, Xw As Single, Yh As Single)
- gr Pointer to display
- C Defined color
- RX0 X point of left bottom logical postion of rectangle
- RY0 Y point of left bottom logical postion of rectangle
GetPhysicalCoords return physical coordinates of specified logical coordinates:
GetPhysicalCoords(ByVal XL As Single, ByVal YL As Single, ByRef XP As Single, ByRef YP As Single)
- XL X point in logical domain
- YL Y point in logical domain
- XP X point in physical domain
- YP Y point in physical domain