This is a python program to predict progression outcomes at the end of each academic year
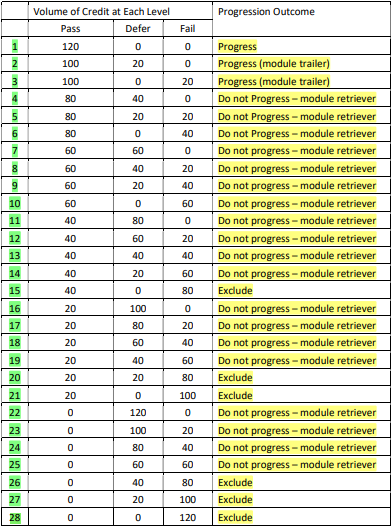
Progression outcomes as defined by the University regulations(see the table).
sd_coursework_part_1_(Base_program-Student_version).py ---------> for students
sd_coursework_part_1_(Main_version-horizontal_histogram).py ----> for staff
-
The program allows students to predict their progression outcome at the end of each academic year. The program prompt for the number of credits at pass, defer and fail and then display the appropriate progression outcome for an individual student (i.e., progress, trailing, module retriever or exclude).
-
Validation
-- The program display ‘Integer required’ if a credit input is the wrong data type.
-- The program display ‘Out of range’ if credits entered are not in the range 0, 20, 40, 60, 80, 100 and 120.
-- The program display ‘Total incorrect’ if the total of the pass, defer and fail credits is not 120.
-- An example of the program running with user input (shown in bold):
Please enter your credits at pass: p
Integer required
Please enter your credits at pass: 140
Out of range.
Please enter your credits at pass: 100
Please enter your credit at defer: 40
Please enter your credit at fail: 20
Total incorrect.
Please enter your credits at pass: 100
Please enter your credit at defer: 20
Please enter your credit at fail: 0
Progress (module trailer)
- Multiple Outcomes & Histogram
-- The program loops to allow a staff member to predict progression outcomes for multiple students.
-- The program prompts for credits at pass, defer and fail and display the appropriate progression for each individual student until the staff member user enters ‘q’ to quit. Optionally you can use an input of ‘y’ to continue.
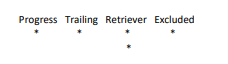
-- When ‘q’ is entered, the program produces a ‘histogram’ where each star represents a student who achieved a progress outcome in the category range: progress, trailing, module retriever and exclude. The histogram should relate to the data input entered by the staff member during the program run and work for any number of outcomes.
-- Display the number of students for each progression category and the total number of students.
-- Example of a program run and input (in bold). Note: program exit on ‘q’ to quit. ‘y’ to continue.
Staff Version with Histogram
Enter your total PASS credits: 120
Enter your total DEFER credits: 0
Enter your total FAIL credits: 0
Progress
Would you like to enter another set of data?
Enter 'y' for yes or 'q' to quit and view results: y
Enter your total PASS credits: 100
Enter your total DEFER credits: 0
Enter your total FAIL credits: 20
Progress (module trailer)
Would you like to enter another set of data?
Enter 'y' for yes or 'q' to quit and view results: y
Enter your total PASS credits: 80
Enter your total DEFER credits: 20
Enter your total FAIL credits: 20
Module retriever
Would you like to enter another set of data?
Enter 'y' for yes or 'q' to quit and view results: y
Enter your total PASS credits: 60
Enter your total DEFER credits: 0
Enter your total FAIL credits: 60
Module retriever
Would you like to enter another set of data?
Enter 'y' for yes or 'q' to quit and view results: y
Enter your total PASS credits: 40
Enter your total DEFER credits: 0
Enter your total FAIL credits: 80
Exclude
Would you like to enter another set of data?
Enter 'y' for yes or 'q' to quit and view results: q
---------------------------------------------------------------
Horizontal Histogram
Progress 1 : *
Trailer 1 : *
Retriever 2 : **
Excluded 1 : *
5 outcomes in total.
----------------------------------------------------------------
-- Extend version of part 1 program to add a vertical histogram (stars in a category should go downwards), e.g.;
-- Extended solution, so that the program uses Python to save the input progression data to a list, tuple or directory. Then access the stored data from the list, tuple, directory and print the data in the following format below.
Output: The following should display after the histogram(s)
Progress - 120, 0, 0
Progress (module trailer) - 100, 0, 20
Module retriever - 80, 20, 20
Module retriever - 60, 0, 60
Exclude – 40, 0, 80
-- This script will save input progression data to a text file. Later in the program, access the stored data and
print out as shown below. Example output (with data from text file):
Progress - 120, 0, 0
Progress (module trailer) - 100, 0, 20
Module retriever - 80, 20, 20
Module retriever - 60, 0, 60
Exclude – 40, 0, 80