![]()
Management of spectroscopic measurement data
Specatalog is a software tool for the systematic management and archival of spectroscopic measurement data in research environments. It combines a structured directory-based data storage system with a relational database (PostgreSQL) for metadata management.
The software is designed to ensure reproducibility, traceability, and long-term accessibility of experimental data. In addition to raw data storage, Specatalog supports the integration of processed data and evaluation results within a unified framework.
Specatalog currently supports the following spectroscopic techniques:
- Time-resolved EPR (trEPR)
- Continuous-wave EPR (cwEPR)
- Pulsed EPR (pulseEPR)
- UV/Vis spectroscopy
- Fluorescence spectroscopy
- Transient absorption (TA)
The system is designed to be extensible, allowing the integration of additional spectroscopic methods. Details on extending the data models are provided in the documentation.
- Structured archival system for spectroscopic data
- PostgreSQL-based metadata database
- Integration of raw data, processed data, and evaluation results
- Storage of analysis results within HDF5 files
- Loaders for common spectroscopic data formats
- Programmatic access via Python script
- Graphical user interface (GUI) for interactive data management
- Synchronization tools for remote data storage
A central aspect of Specatalog is the tight coupling between metadata and data storage, enabling consistent and reproducible data handling across projects.
The graphical user interface provides tools for interactive data management and inspection.
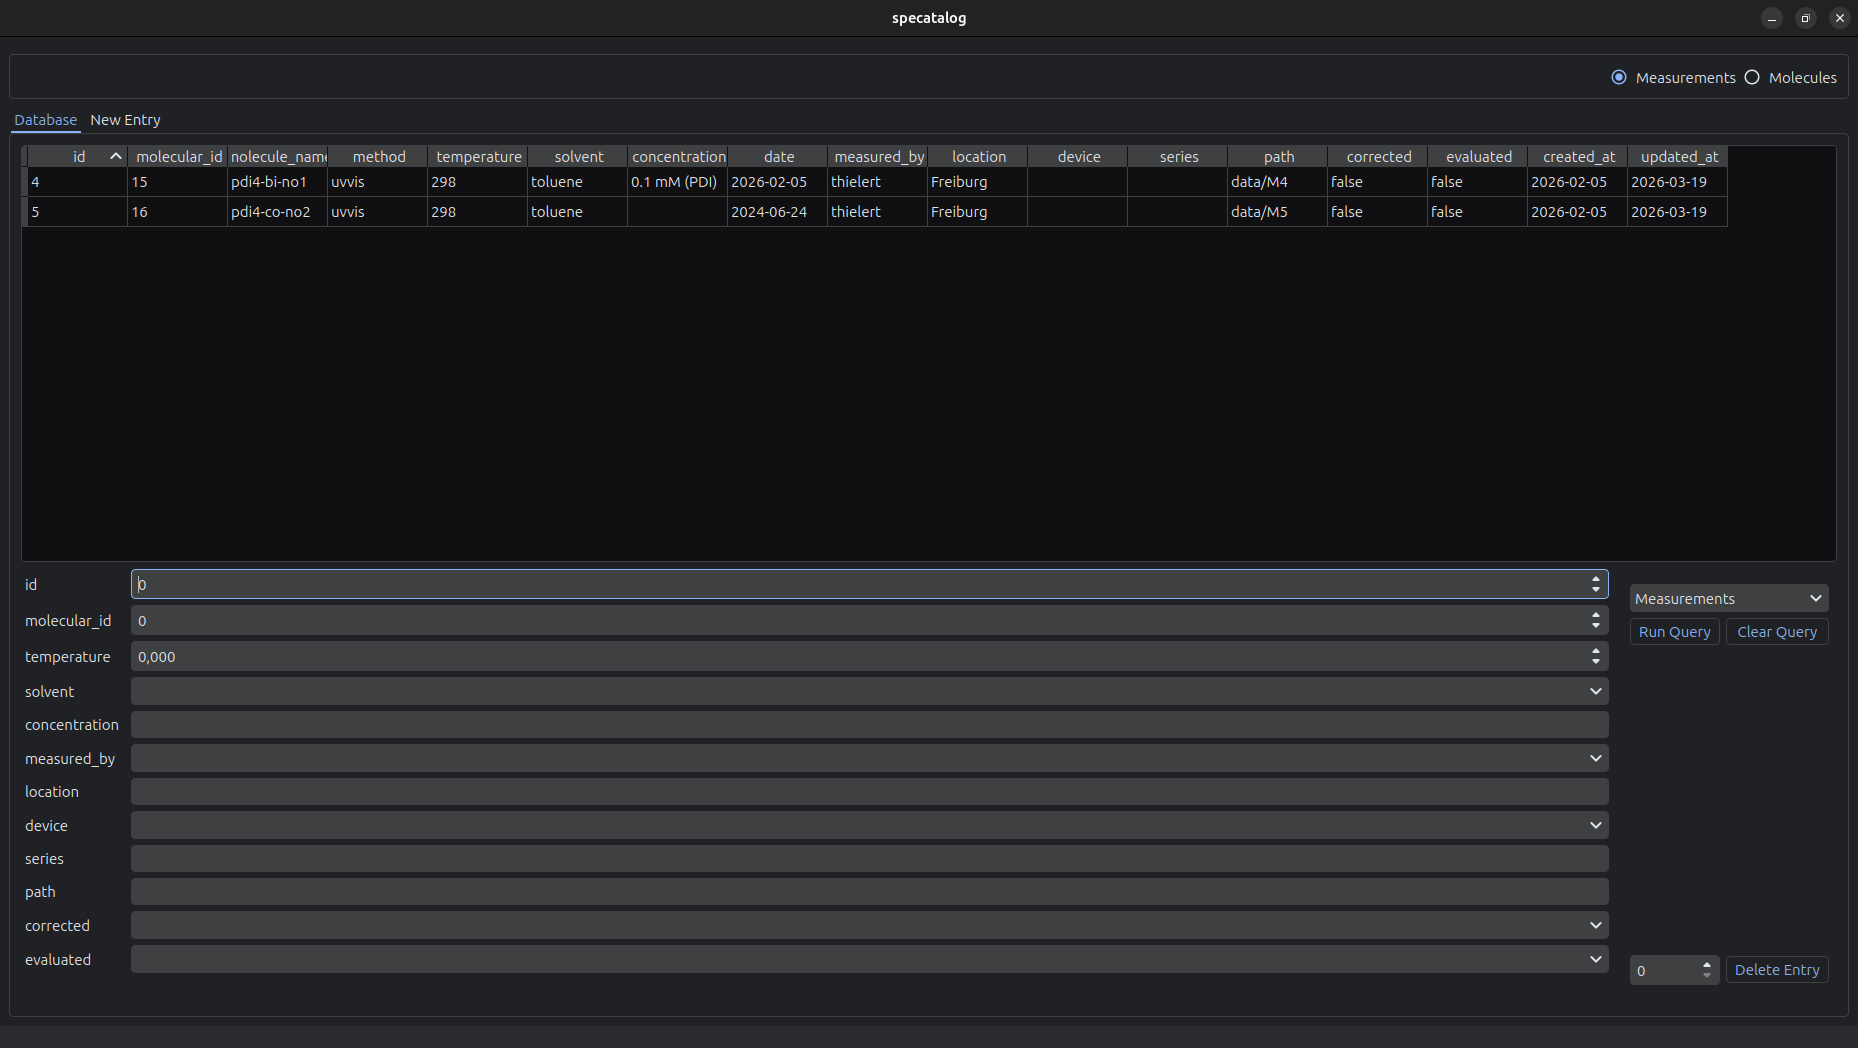
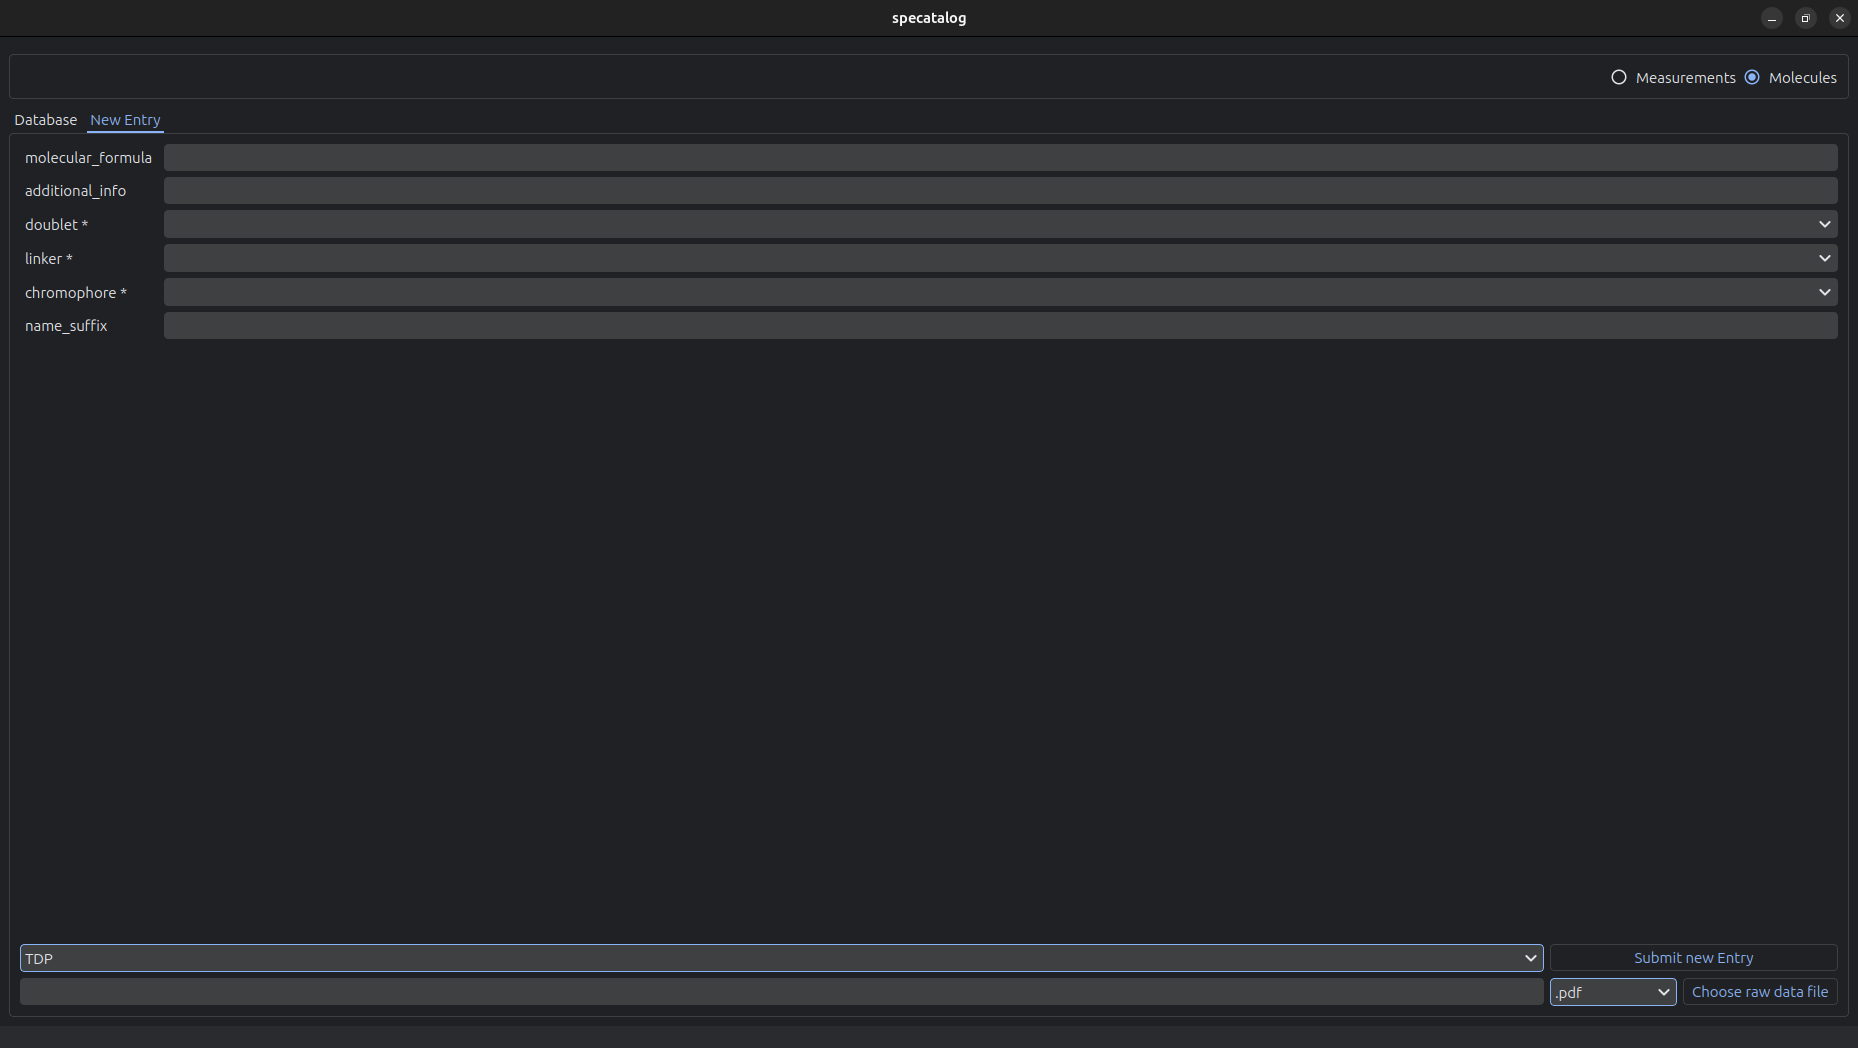
The GUI supports:
- Browsing and searching the database
- Tabular display of entries
- Editing and deletion of existing entries
- Creation of new entries
- Upload of raw measurement data into the archive
Clone the repository and install the package locally:
git clone https://github.com/TheresiaQuintes/specatalog.git
cd specatalog
pip install .
Alternatively just run:
pip install specatalogAll dependencies are specified in the pyproject.toml file.
Consult the documentation for the first-time-setup.
- Python = 3.11
- PostgreSQL database
- Operating systems: Linux, macOS, Windows
Specatalog provides several command-line tools:
-
specatalog-welcomeVerifies installation and prints the current working directory -
specatalog-configurationInitial configuration of the system -
specatalog-guiLaunches the graphical user interface -
specatalog-sync-download,specatalog-sync-uploadSynchronization with remote directories -
specatalog-update-dbUpdates database models
Specatalog separates metadata and data storage while maintaining a strict linkage between both.
base_dir/
├── data/
│   ├── M1/
│   ├── M2/
│   ├── ...
│   └── M{ms_id}/
│       ├── additional_info/
│       ├── figures/
│       ├── literature/
│       ├── raw/
│       ├── scripts/
│       └── measurement_M{ms_id}.h5
├── molecules/
│   ├── MOL1/
│   ├── MOL2/
│   ├── ...
│   └── MOL{mol_id}/
│       ├── file_with_structure.cdxml
│       └── file_with_structure.pdf
└── allowed_values.py
Each measurement is associated with a structured HDF5 file:
measurement_{ms_id}.h5
├── raw_data
│   ├── data
│   ├── data_imag
│   ├── data_real
│   └── xaxis
├── corrected_data
│   └── <user-defined datasets>
└── evaluations
    └── <user-defined datasets>
This structure allows storing both raw data and derived results in a consistent and extendable format.
from specatalog.models import creation_pydantic_measurements as ms
from datetime import date
from specatalog.helpers.full_entry import create_full_measurement

new_measurement = ms.TREPRModel(
    molecular_id=1,
    temperature=80,
    solvent="toluene",
    date=date(2025, 12, 24),
    measured_by="your_name",
    device="ELEXSYS",
    frequenc_band="Q",
    attenuation="20dB",
    exciation_wl=530
)

fm = create_full_measurement(new_measurement, BASE_PATH, raw_data, "bruker_bes3t")

print(fm.success)
print(fm.measurement_id)from specatalog.crud_db import read as r
filter_model = r.TREPRFilter(
molecular_id=1,
temperature__le=80,
measured_by="your name"
)
results = r.run_query(filter_model, ordering_model)
print(results)
print(results[0].id)
print(results[0].molecule.name)from specatalog.data_management.hdf5_reader import load_from_id
import matplotlib.pyplot as plt
import numpy as np
dat, file = load_from_id(1, mode="a")
x = dat.raw_data.xaxis
intensity = dat.raw_data.data
plt.plot(x, np.real(intensity))
offset = 2.3
corrected = x - offset
fit = -2 * (x - 12000)**2 + 2500
dat.corrected_data.set_attr("x-offset", 2.3)
dat.corrected_data.set_dataset("xaxis", corrected)
dat.evaluations.set_dataset("fit1", fit)Comprehensive documentation, including installation details and instructions for extending the data models, is available at:
https://theresiaquintes.github.io/specatalog/
Specatalog is intended for the archival and management of spectroscopic data in academic and industrial research environments. It is particularly suited for laboratories that require structured data storage, standardized metadata handling, and reproducible analysis workflows.
This project is licensed under the GNU General Public License v3.0 (GPL-3.0).
Contributions, issue reports, and feature requests are welcome.