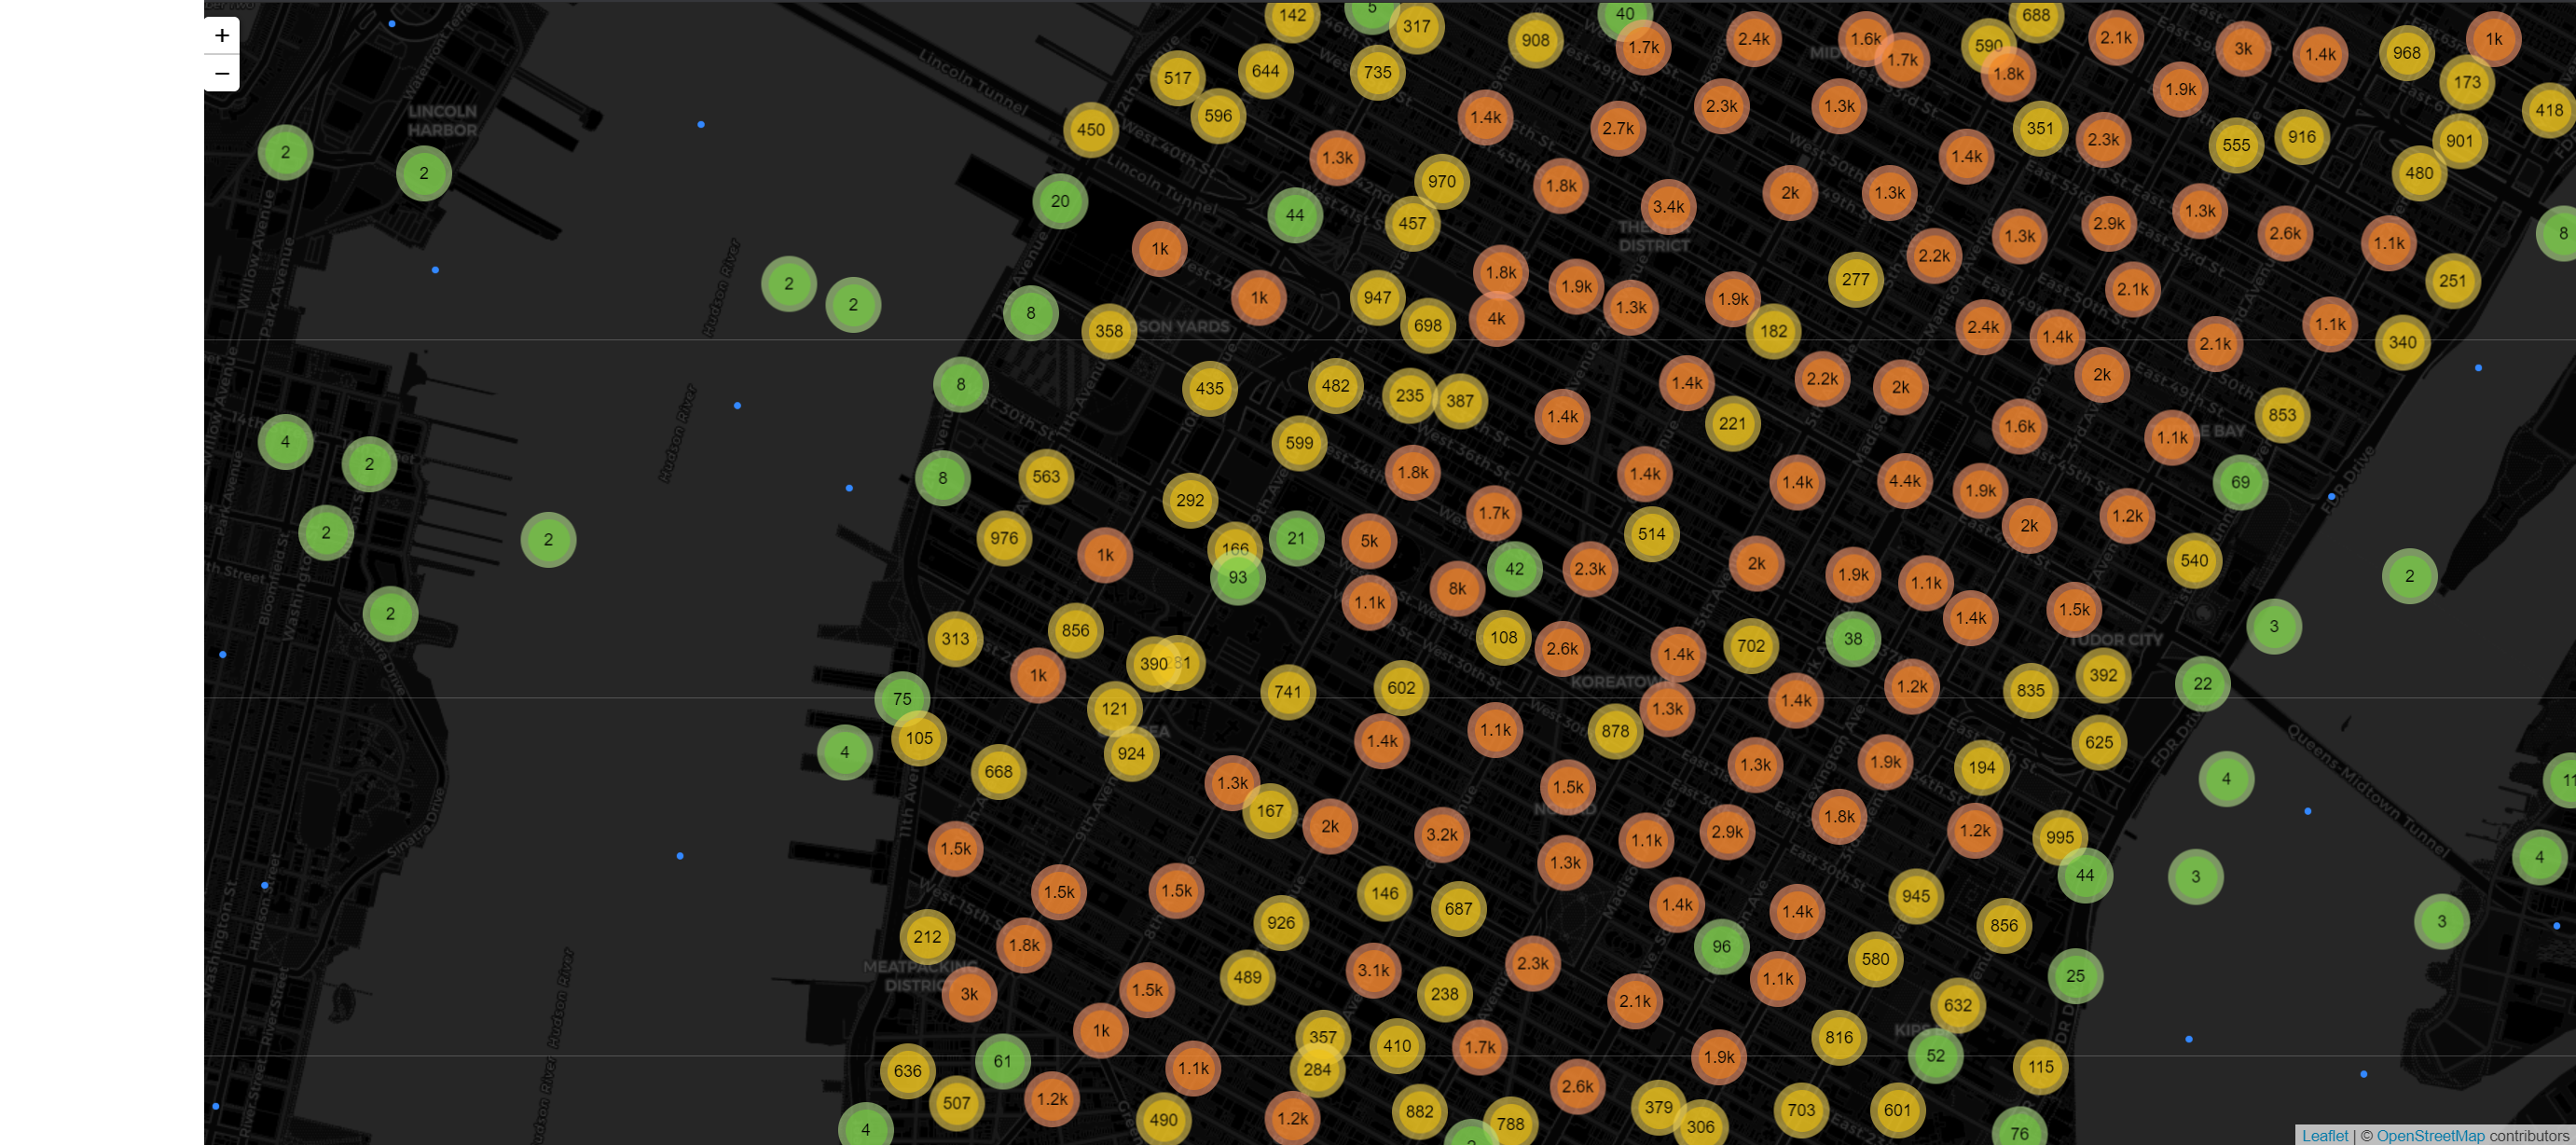
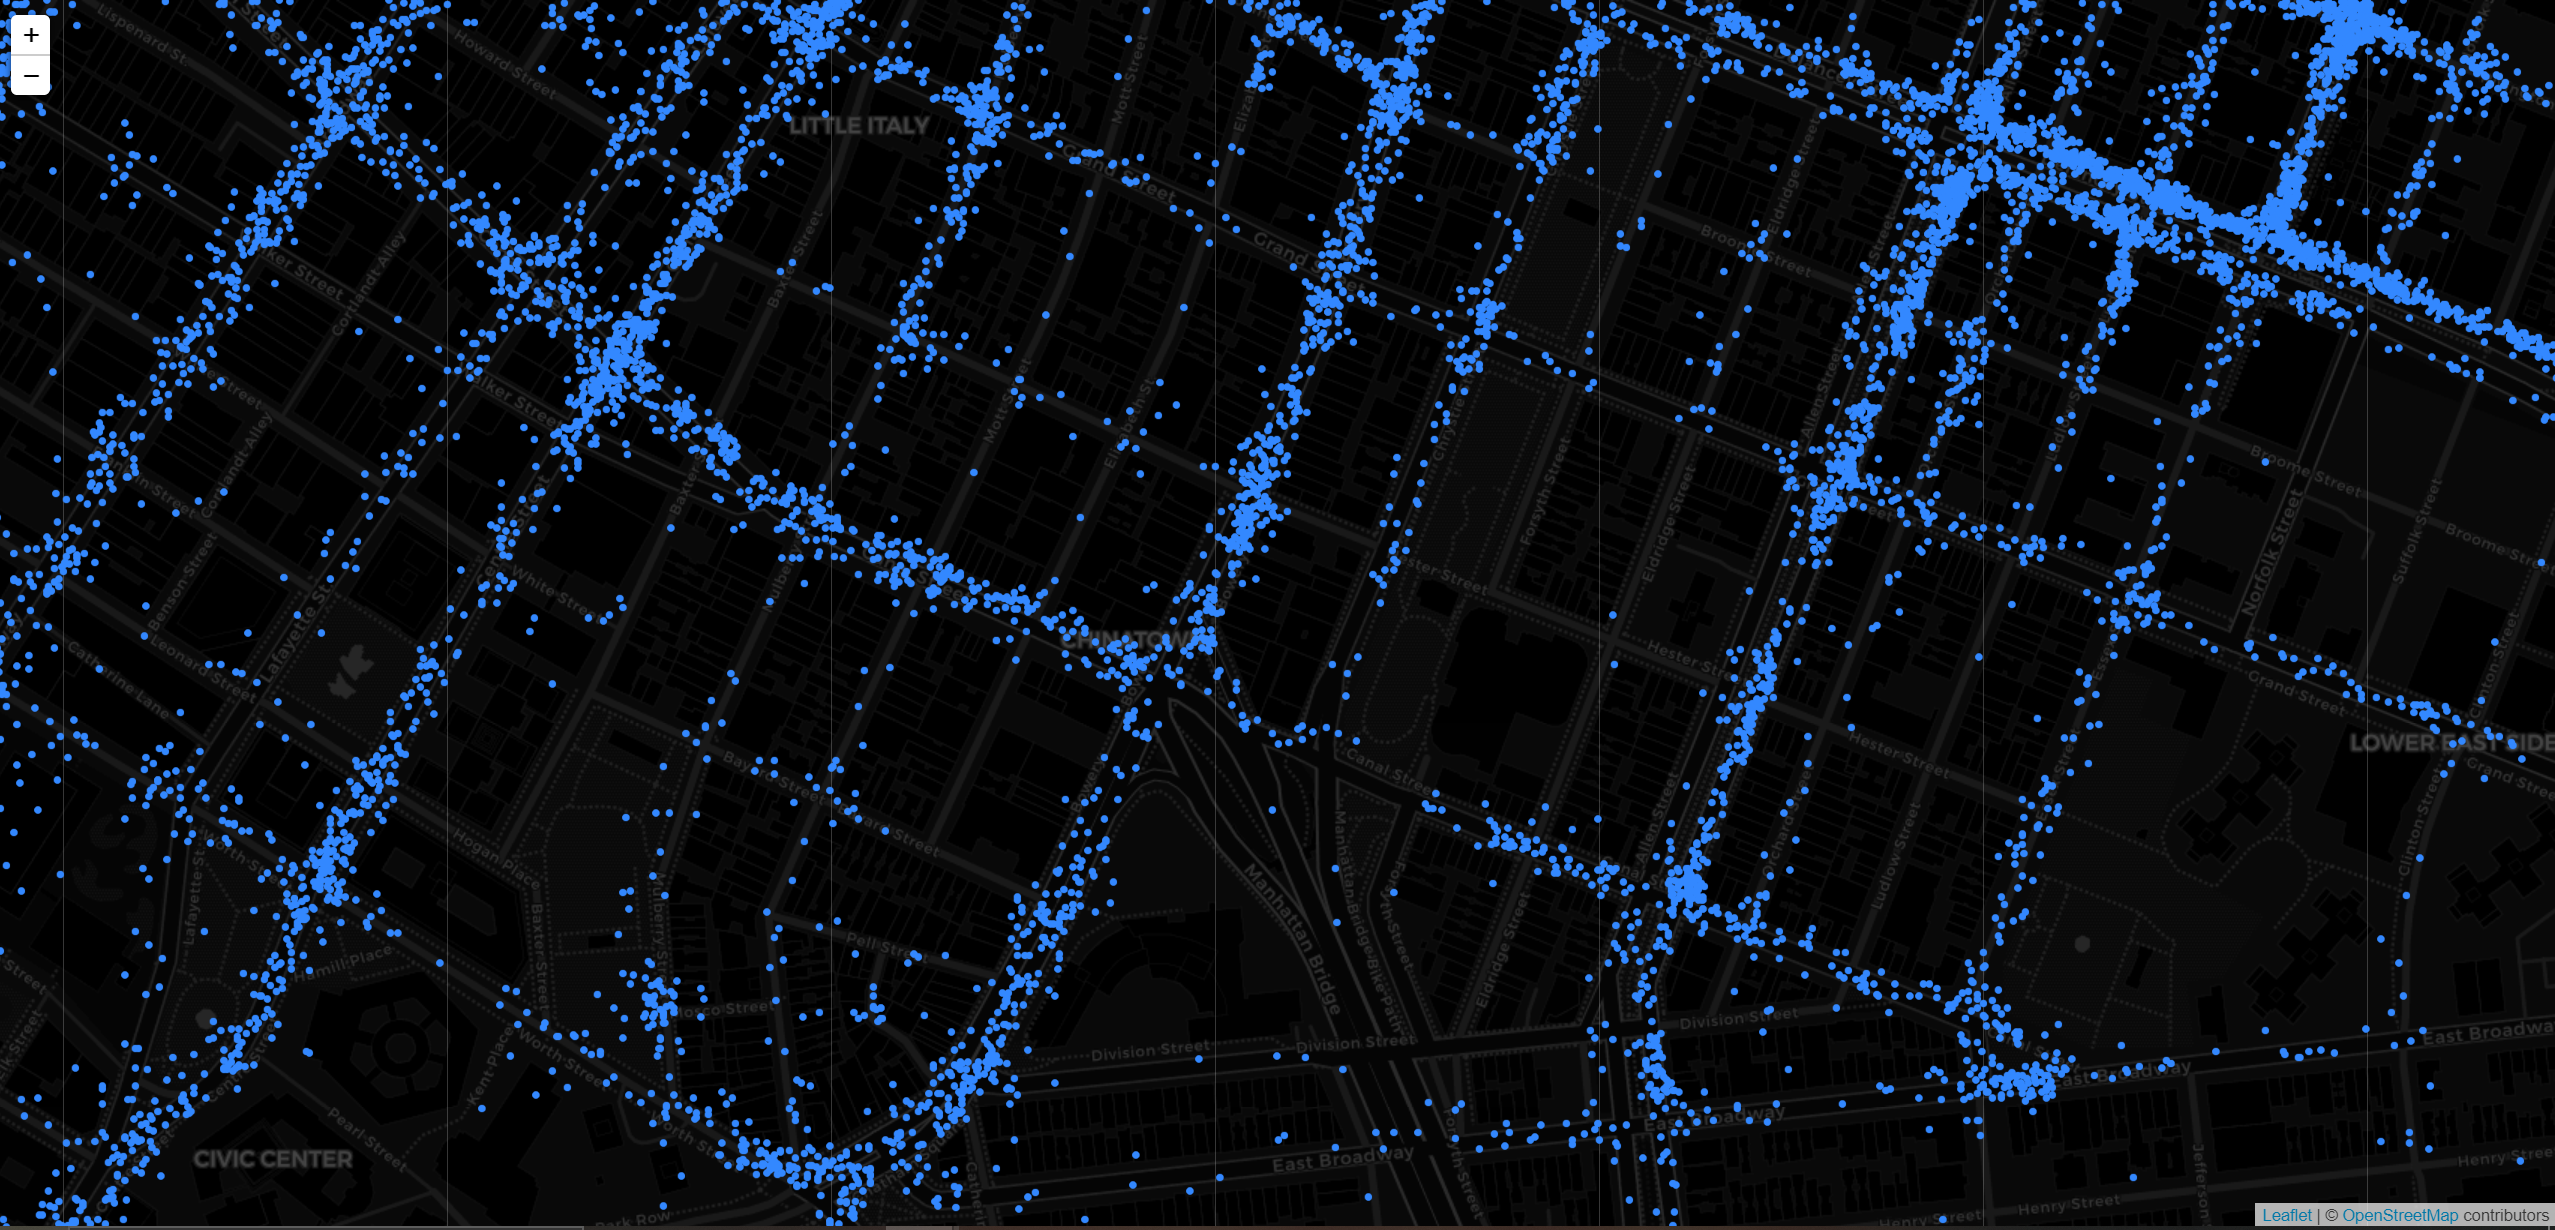
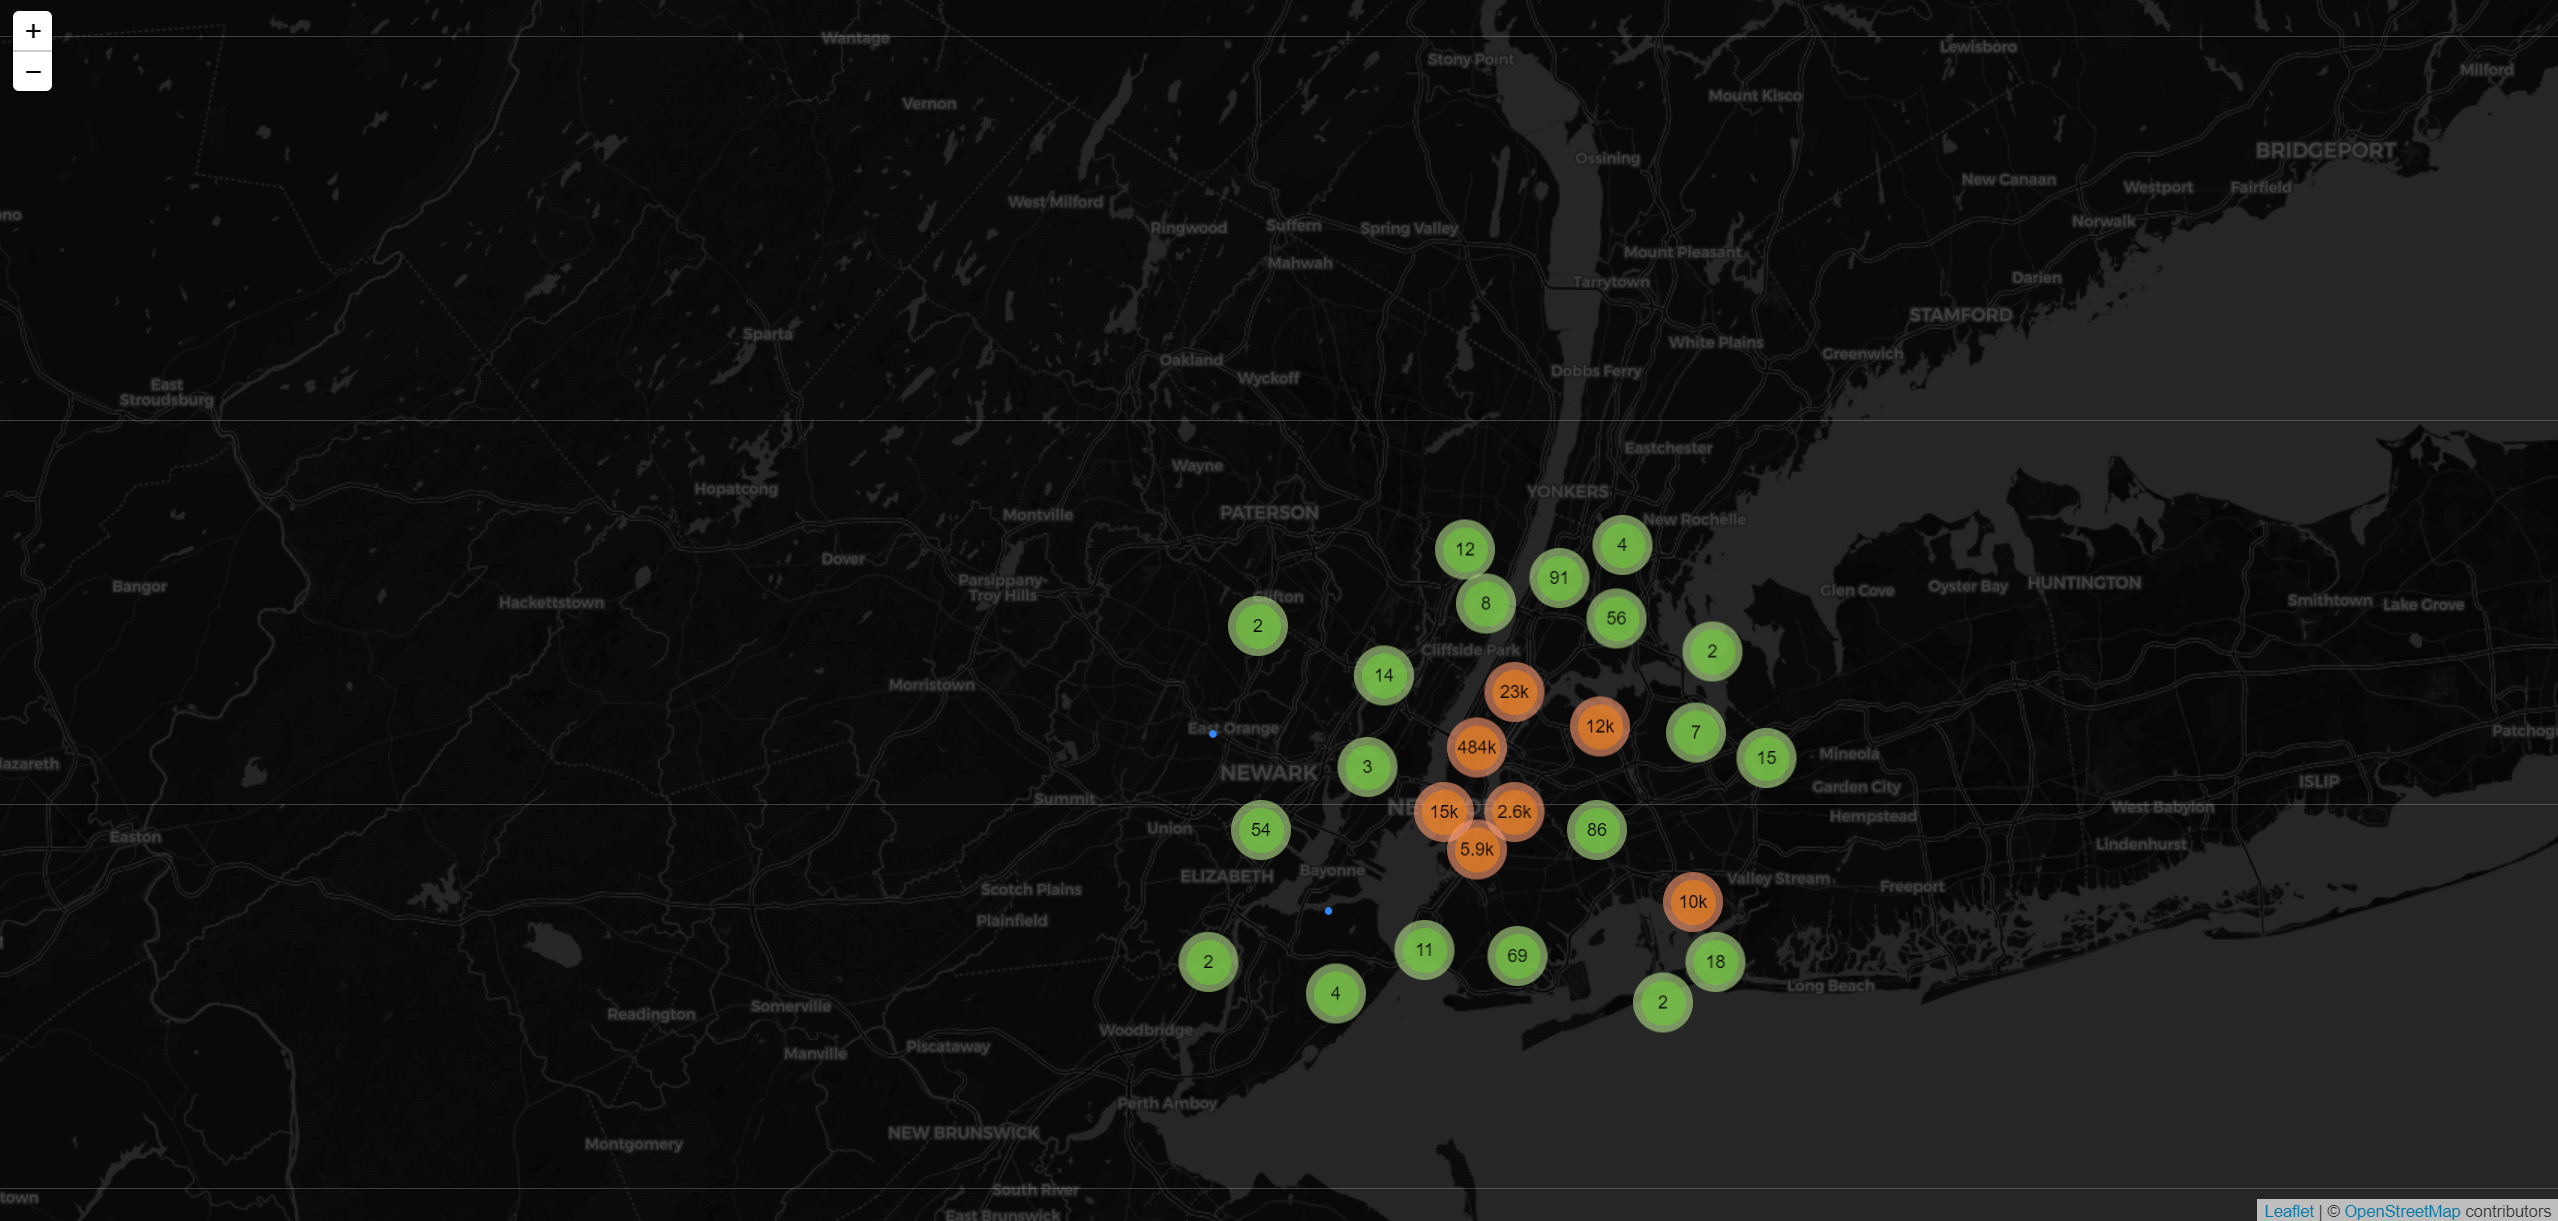
New York City has publicly released Taxi trip data for every trip from every taxi from 2014 to 2018. The web application shows the dataset of the pick-up locations on the map in New York City during January, 2015. When zooming down to an individual point, it will be displayed as a blue circle marker. On the other hand, zooming out will show clusters representing points in the specific area.

- JavaScript Framework - React.js
- Open-source JavaScript library for interactive map - Leaflet & React-Leaflet
- Component contains stateless React compomnents and export to container for usage while container contains stateful component (i.e Map.js) to manipulate the state
- Using CircleMarker instead of Marker because the latter load logo and shadow image by default, which will put extremely high pressure on browser if we are going to render millions of points at the client-side
- Filter for a specific date range according to users' input
- Restrict viewable area for users for the security reason
- Users from different time zone