Antonio Montilla Portfolio with recent working projects
- This projects aims to address the need for timely and precise information on rental conditions in the city of Madrid.
- We introduce a rental price barometer utilizing listings from the Idealista portal.
- Specifically, we develop a predictive model for rental prices in Madrid based on the portal's information at the beginning of December 2023, adding up to 4,500 listed properties.
- The random forest regressor, trained and tested on data from Idealista, demonstrated robust predictive capabilities with an accuracy score (R2) on the test set of 0.8. This high accuracy attests to the effectiveness of our approach in capturing rental price variations based on property features.
- The trained model is incorporated into a rental barometer interface, engaging users in providing property features for a model-based prediction aligned with market prices as of December 2023.
- The interface provides users a predicted rental price range, statistical insights (average, minimum, and maximum) on current available properties matching the criteria, and a curated list of up to 5 potential listings.
- Additionally, users can access socio-economic information for the searched district sourced from Madrid’s government open data portal, featuring details on parks, health facilities, and resident demographics.
- While the model lacks real-time updates due to data limitations, potential development in that direction is acknowledged.
- This project aims to unveil some of the variables influencing dynamic pricing algorithms in ride-hailing companies, with a specific focus on how weather conditions and the time of day or week impact ride costs.
- Leveraging data obtained through Uber and Lyft APIs and accessible on Kaggle (Dataset Link), we delve into a dataset comprising 693,071 rows of simulated rides with real prices. Collected in the city of Boston in November 2018 for 12 specific districts, this dataset serves as the foundation for our exploration into the intricate dynamics of ride-hailing pricing strategies.
- Overall, according to the results of our regression analysis, distance is by the far the most influencing factor in the estimated price of ride-hailing services, a factor that is indeed the fundamental input that Uber identifies when disclosing how it sets its standard rates.
- Other factors that have some relevance in prices are also the type of service chosen in the App, for example if the request is for a wheelchair-accessible vehicle or for a large car (XL).
- However, the analysis also showed that the price per mile set by Uber could be incremented during periods of high demand, relative to the number of available drivers (using a dynamic pricing algorithm).
- For example, in morning rush hours, there is evidence that the average price per mile could be 15% higher relative to the average price per mile in the overall database. In afternoon rush hours or during the weekend, there is also some evidence of higher average prices. By contrast, except during very extreme circumstances, there was little evidence to suggest that weather conditions significantly affect prices.
- Overall, prices get incremented relative to standard rates only in a relatively small share of the observations (for the Lyft database, dynamic pricing took place only in 7% of total rides).
- There a number of caveats, however, to highlight in this analysis. Take a look at the repository to learn more insights, data limitations and further analysis.
- This project tries to develop models that could allow predicting whether a transaction is fraudulent or not, through the analysis and manipulation of a database that contains information on 590,540 transactions carried out online through the Vesta platform.
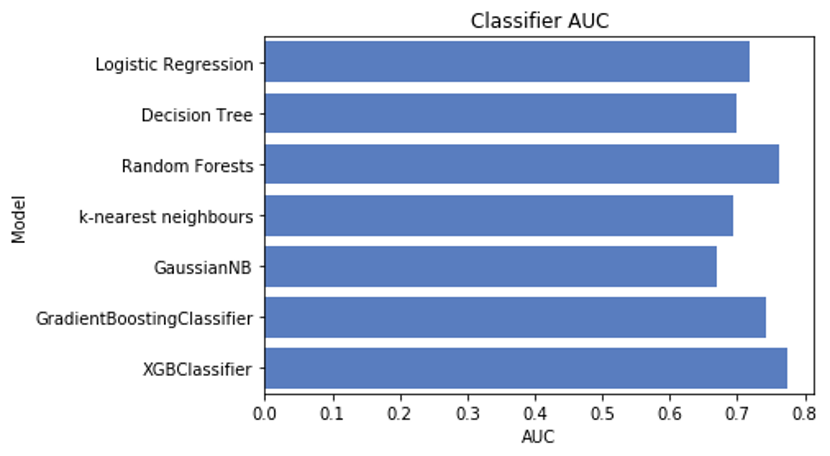
- The project evaluates the most relevant variables to predict the veracity of a transaction, builds models and selects the one that best fits the data.
- As a general conclusion, it was identified that the classification algorithms of XGBClassifier, GradientBoostingClassifier and Random Forest are the ones that best fit the data, giving rise to a deeper development of this type of models in future works.
- For its further application, the distribution of the target variable must be taken into account, and ensure that the dataframe to be used in the modelling is balanced.
- Once the modelling process has been improved, the next task would be the development of algorithms that, based on the prediction of the veracity of a transaction, instruct mechanical tasks for its validation by the user. An example would be developing an application that automatically checks with the user if they are carrying out the transaction in question.
ROC Curve Models 2.0