Analyze all the rideshare data from January to early May of 2019 by city type and create a compelling visualization for the CEO, V. Isualize at PyBer.
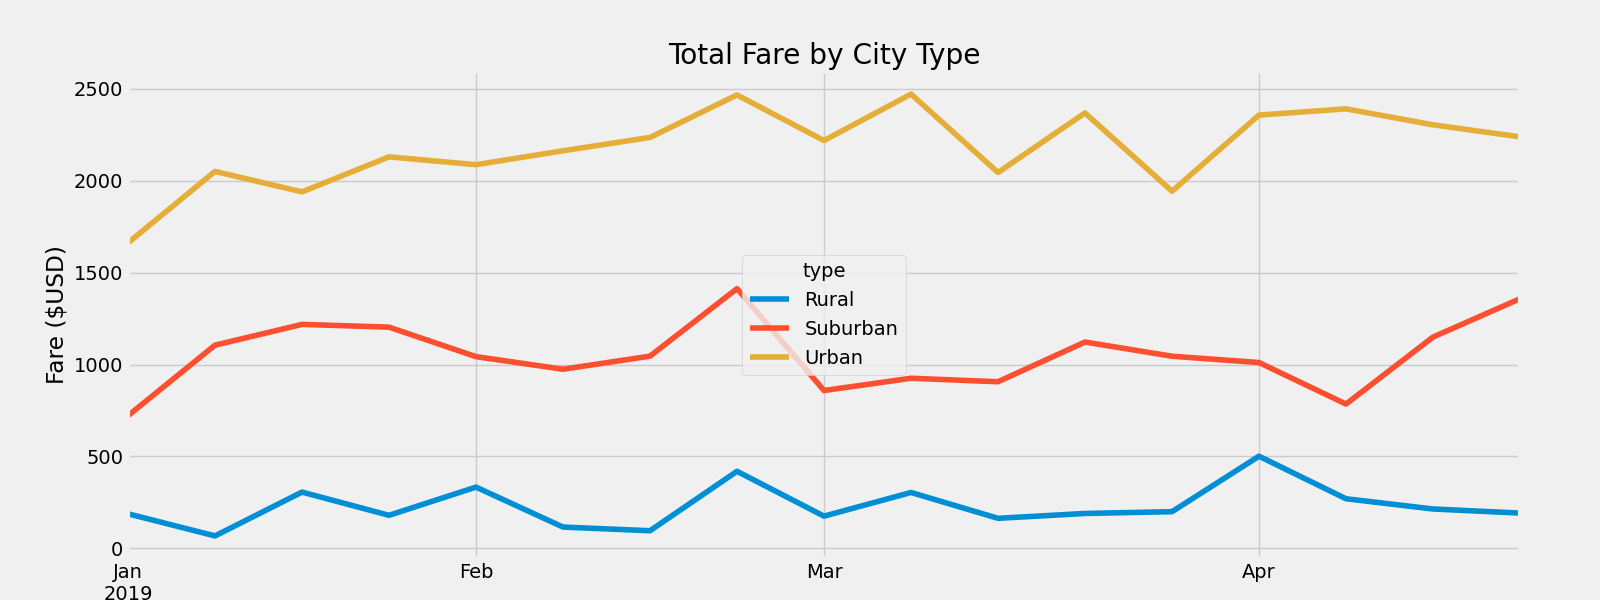
The purpose of the analysis is to summarize how the data differs by city type and how those differences can be used by decision-makers at PyBer. In addition to the analysis our job is to create a visual that that shows the total weekly fares for each city type.
Based on the data, there were significantly more rides taken in urban than rural and suburban areas combined. In addition, urban rideshares brought in more income than rural and subrban areas combined.
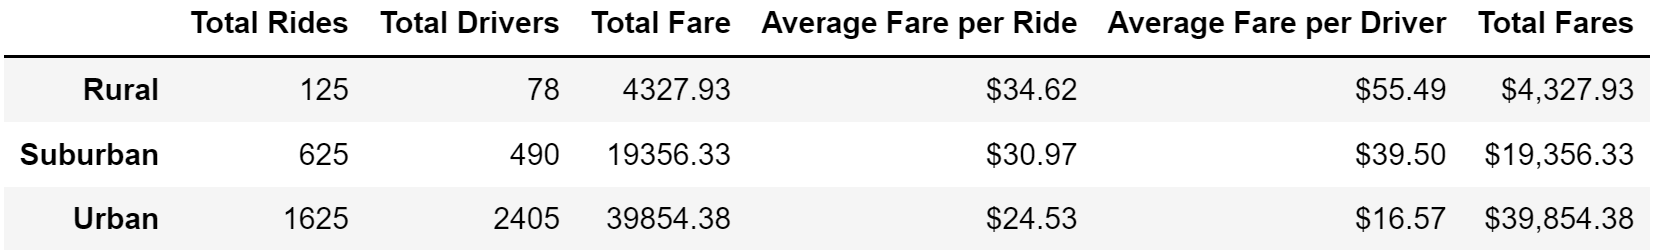
Based on the results, I beleive the company can increase the costs of the fare since there is a high demand of this service. The revenue gained from the fare increase can be used to improve operations for all stakeholders.