An essential talent for someone working in the data visualization industry is the ability to design user-friendly interactive maps. Maps let us explore, comprehend, and decide about my world, from the New York Times to initiatives for the Center for Strategic International Studies.
I’ll use the D3 library and my knowledge of JavaScript to construct an interactive globe map in this module. I'll employ GeoJSON, a kind of JSON file created expressly to store geographic data.
Many apps with mapping capabilities, like ride-sharing, navigation, and food and package delivery services, use GeoJSON data. You can utilize GeoJSON data and monitor my whereabouts using even the applications on my smartphone. The industry standard for encoding basic geographic characteristics and non-spatial information is GeoJSON.
I'll look at geographic elements like points, which have addresses, and places, which have coordinates like latitude and longitude. Tectonic plate borders are marked by line-strings that provide coordinates for their locations. likewise polygons with coordinates for the borders of regions like counties, nations, provinces, and swaths of territory.
Additionally, I'll discuss non-spatial qualities, which are data that are stored in a GeoJSON file's hierarchical structure and are unrelated to any geometrical concerns. Examples include altitude, temperature, amount of rain, size of the hail, tornado or hurricane strength, and earthquake magnitude.
I will navigate and obtain GeoJSON earthquake data and tectonic plate data to create a geographical map using my expertise with JavaScript and the D3 library. I'll also make use of the Mapbox Al and the leaflet library for this.
Let's begin by populating a map with information from a GeoJSON file using JavaScript, the D3 and leaflet frameworks.
-
I have just secured a fantastic job opportunity: "Specialist in Data Visualization for the Disaster Reporting Network". A non-profit organization that uses statistics to create stories about disasters all across the world. If I accept the mission, I will be tasked with creating interesting data visualizations with interactive elements on earthquakes from across the world.
-
Basil, the chief of the seismic disaster response team, feels that this initiative will be beneficial to his team of reporters and data visualization experts. He expects that producing earthquake maps that are both informative and easy to use on desktops and mobile phones would help the Disaster Reporting Network gain traction.
-
In my new role, I'll assist in the construction of websites and mobile applications by utilizing the most recent earthquake GeoJSON data from the USGS website. Using JavaScript and the D3 and leaflet libraries, I'll browse and obtain earthquake data, then plot it on a Mapbox map via an API call.
-
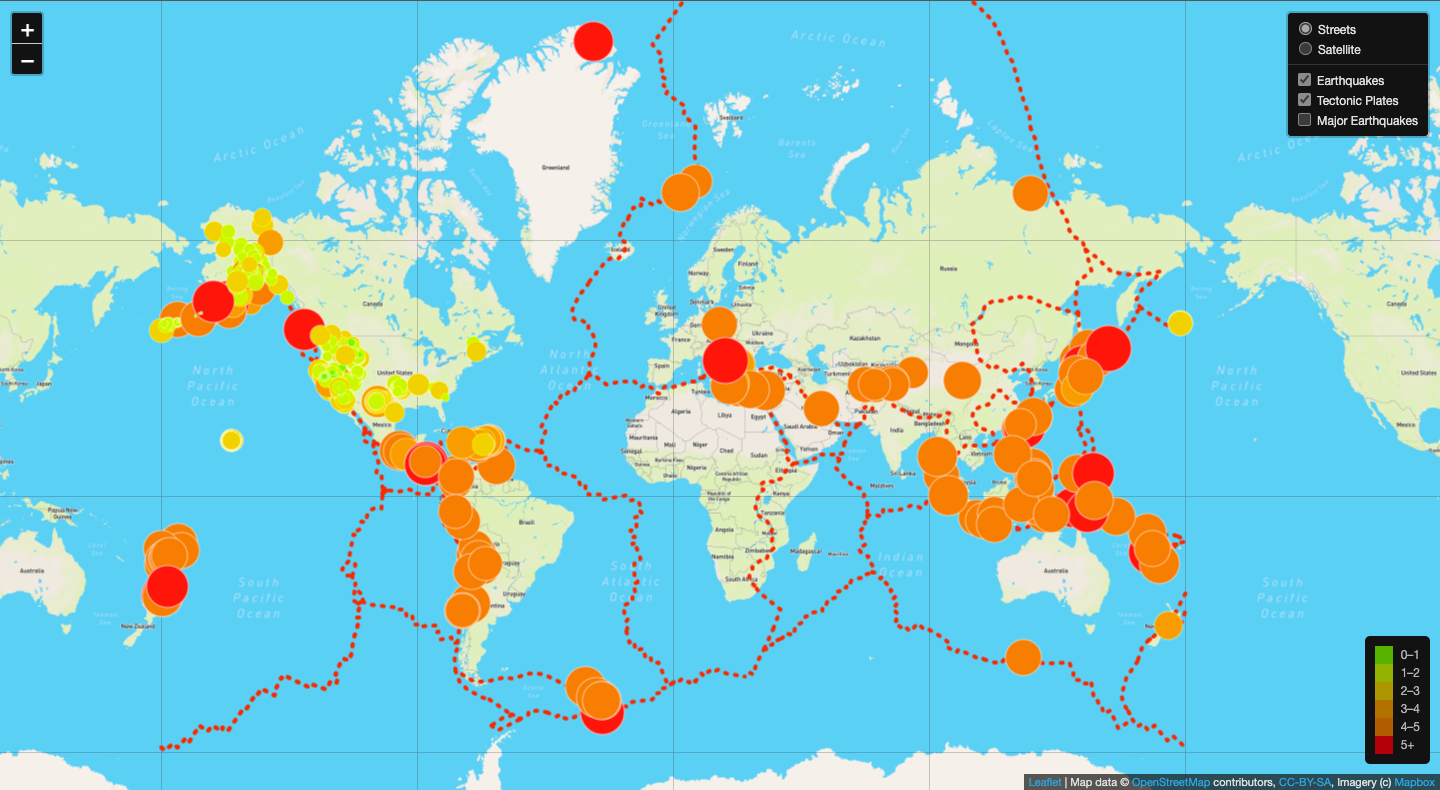
Each earthquake's magnitude and location will be displayed in a popup marker on your map. The size and color of the marks for each earthquake should correspond to the magnitude of the event. Higher-magnitude earthquakes will look larger and darker in color, and a legend will provide context for my map data.
-
Finally, fault lines will be added to the map to show the link between the location and frequency of seismic activity and tectonic plates. I'll be able to upload my earthquake map to your online portfolio once I've finished it. If I play my cards well, the team may invite me to continue on and build similar disaster maps in the future.
Image 1. Final Mapbox Map with Major Earthquakes over Satelite Layer
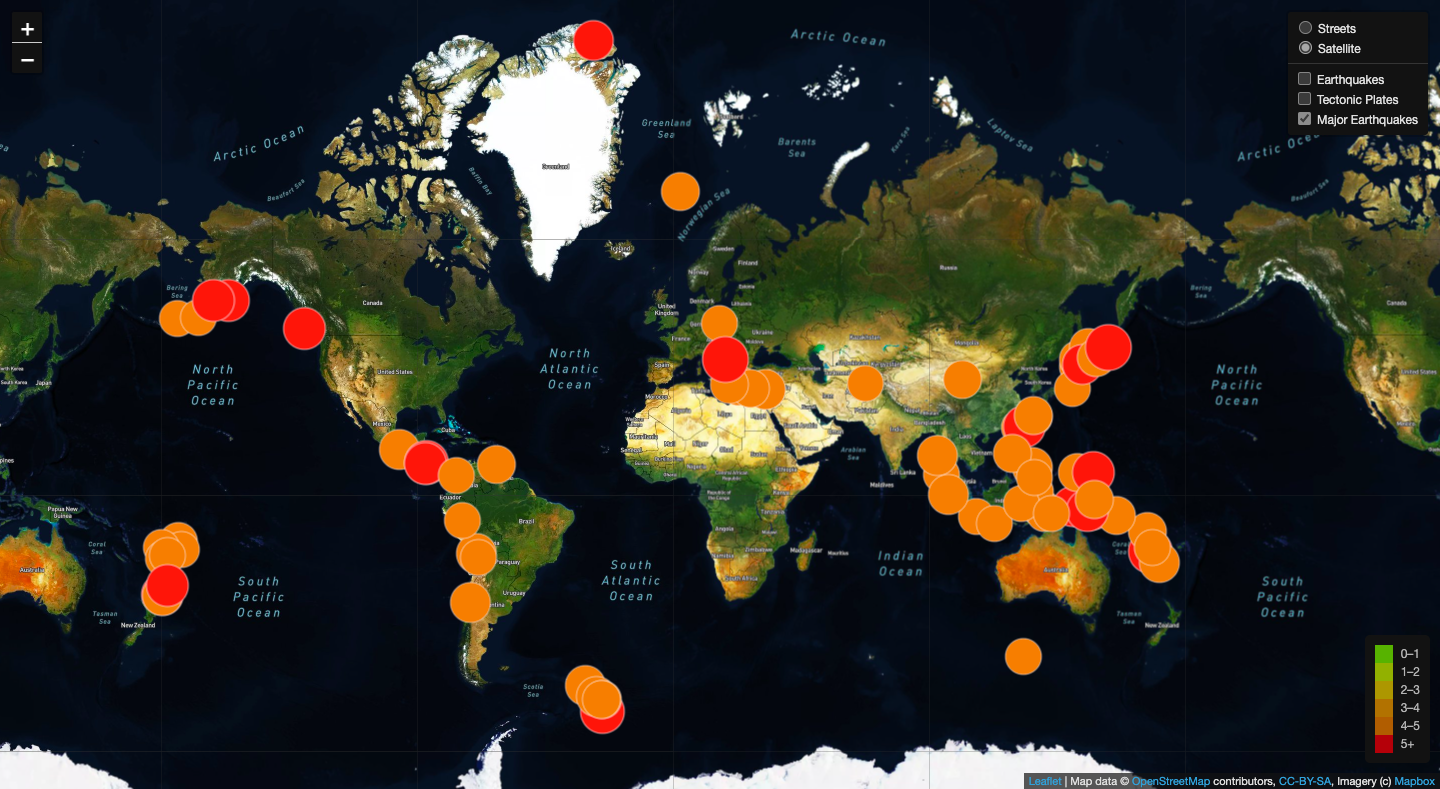
Image 2. Final Mapbox Map with Tectonic Plates over Satelite Layer
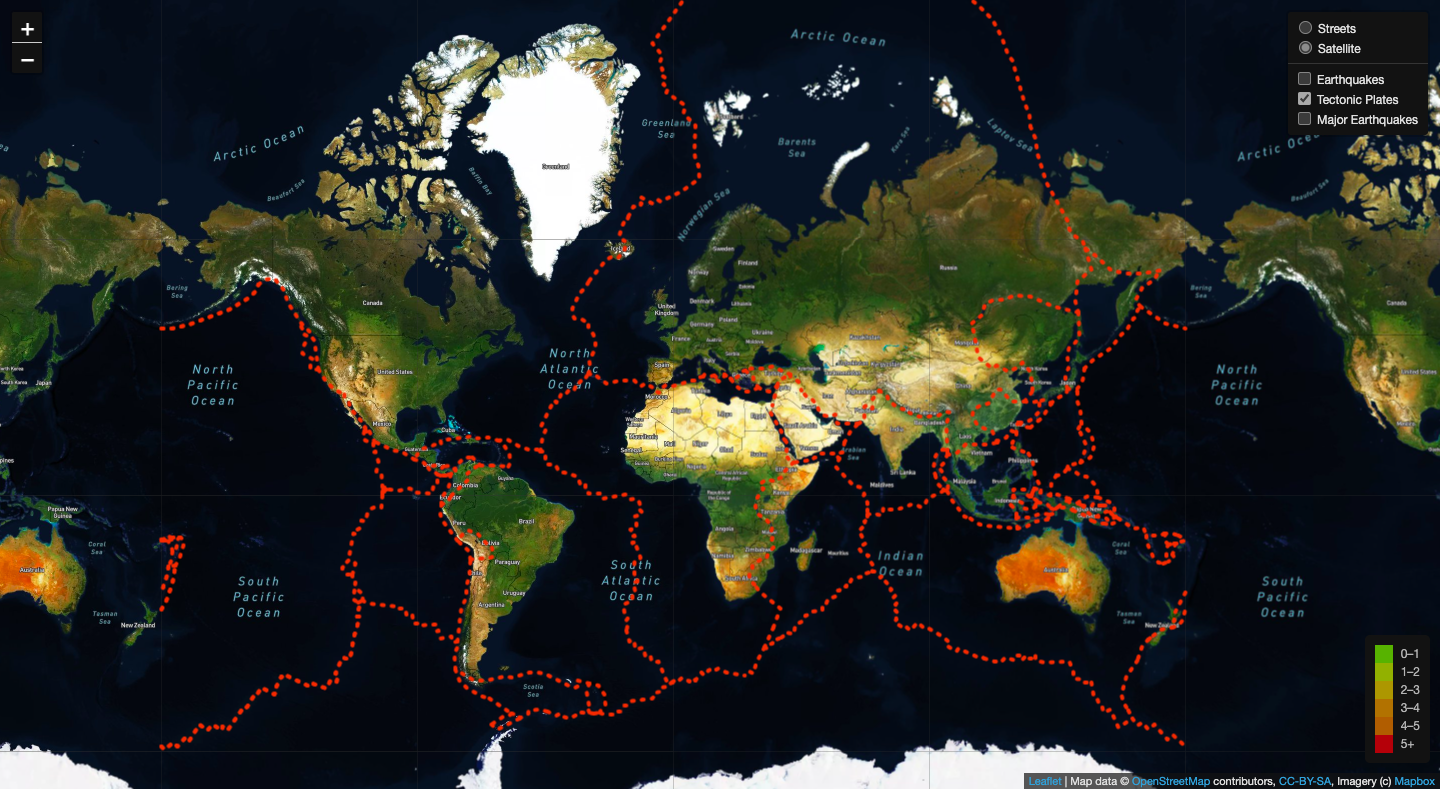
Image 3. Final Mapbox Map with All Earthquakes and Tectonic Plates over Street Layer