A regression and classification problem to calculate the closing price of the NASDAQ composite index on a given day based on a series of domain-centric feature vectors. I compared two research papers based on the different methodologies used.
The two research papers compared are :
Stock Market Prediction by Using Artificial Neural Network
A Machine Learning Approach for Stock Price Prediction
There are five basic input vectors used in all papers predicting stock market prices.
• Open Price
• Low Price
• Volume
• High Price
• Adjusted Close Price
The output vector is the Close Price of the stock on a given day.
There are totally 1223 data points, each data point signifying the stock index from
3/29/2012 to 3/28/2017. The first paper used data points from 2012-2013, and our research
reproduction is based on a five year data pool.
Data source:
https://www.quandl.com/data/NASDAQOMX/COMP-NASDAQ-Composite-COMP
Neural Networks
SSVM
class sklearn.neural_network.MLPRegressor (solver='lbfgs', hidden_layer_sizes=10, shuffle=True, max_iter=150, random_state=1, momentum=0.75, alpha=0.4)
There are three solvers available in sci-kit learn out of which lfbgs has been used here. The
other parameters are quantified below.
Before fitting X and y, I must first normalize the input vectors in order to avoid local
optima.
The epoch number (maximum iterations) was determined by running an iteration of the
MLP before a constant mean error was reached.
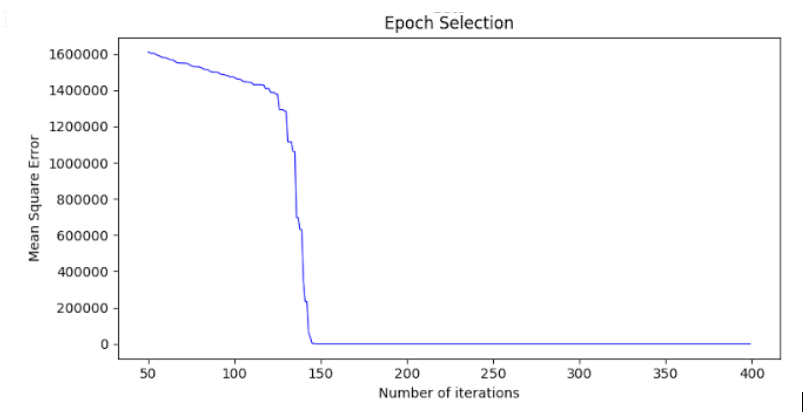
I reached a lower number of maximum iterations than the research paper due to a much
larger dataset.
Using this epoch value, I can calculate the mean square error to compare accuracy with
the research paper. The authors have attained error in the range of -120 to +100. The mean
square error obtained by us is 210.01, and the error range is as follows.
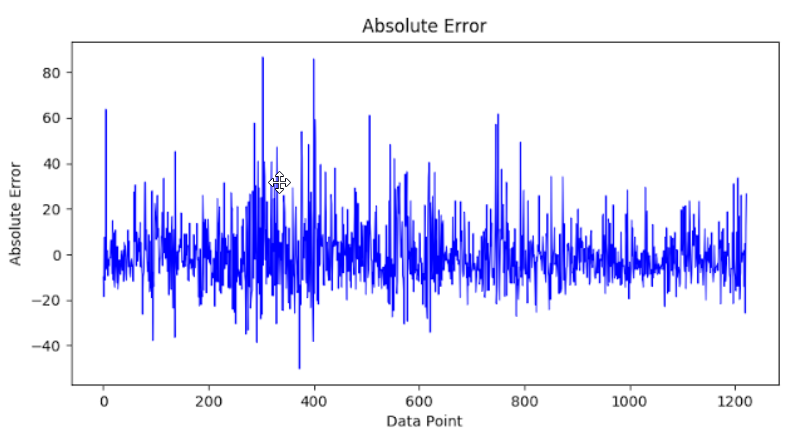
The range of MSE is -40 to 80.
In conclusion, this paper was reproduced with almost identical results, resulting in an error
of approximately 0.2%.

The second paper employs Structured SVM on a very similar dataset, but with additional
feature vectors for classification. Since sci-kit learn does not support SSVM, a third party
library called pystruct was used. New features were introduced such as Daily Return in
order to transform the problem statement into a classification of positive return or
negative return.
The advantage of SSVM is that unlike traditional SVM, a graph structure can be used as
input. Each node of the graph is a company, and each edge denotes a collaboration
between two companies. The relationship between two companies who collaborate is
associative, and each company will see a profit if its partner company also sees a profit.
However, this assumption was not justified in the research paper, and further
reproducibility was hindered due to very vague methodologies used.
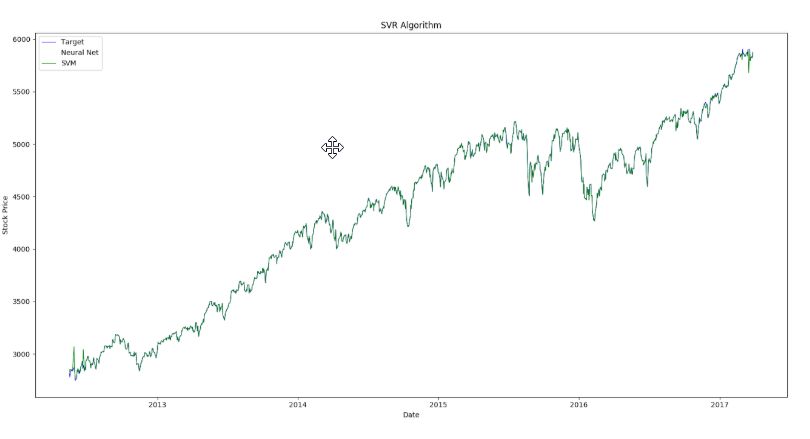
Therefore, I implement traditional SVM to our first research paper and compare results.
class sklearn.svm. SVR(C = 1000.0, epsilon= 0.1, cache_size=10000)
The parameters can be further tuned using the GridSearch algorithm.
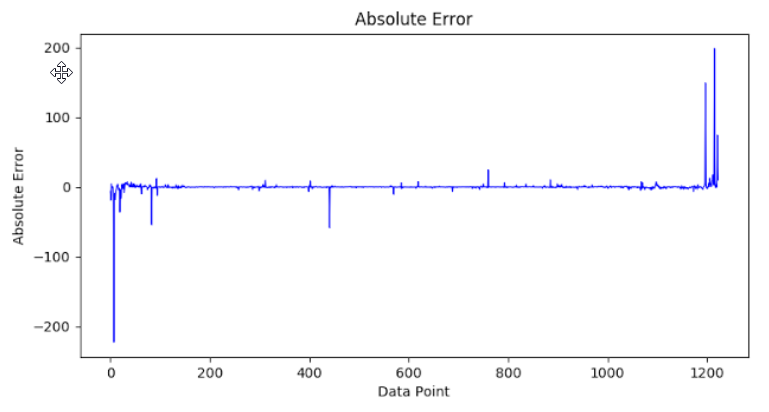
A mean square error of 106.94 was obtained, which proves the superiority of SVR over
neural networks in this problem.
SVR also requires regularized values as inputs and tuning of epsilon and C is very
important.
Further regression algorithms were also considered, such as Logistic regression, later discounted due to floating point feature vectors.