By: Estela Perez
The purpose of this assignment was to process raw data to fit the machine learning models. Several clustering algorithms were used to explore where the patients could be placed into distinct groups of patients that would be better to analyze separately. All in effort to predict myopia, or nearsightedness.
- Used Pandas DataFrame to read in the myopia.csv file
- Removed unecessary column from dataset
- Standardized dataset
- Performed dimensionality reduction with PCA
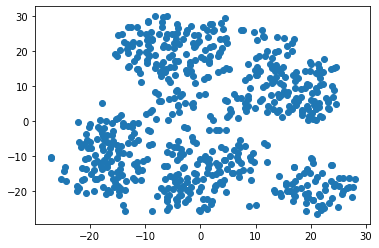
- Reduced the dataset dimensions with t-SNE
- Created a scatter plot of the t-SNE output
- Created an elbow plot to identify the best number of clusters
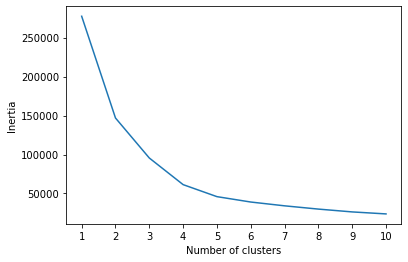
Based on the data findings, the patients would be able to be clustered. By looking at the scatter plot and elbow plot, I would recommend patients be placed into 5 clusters