This is the implementation of a Python library, otherwise known as "KubeRNP", for interacting with a Kubernetes cluster.
You can use this lib with a JupyterHub instance or directly from your Python SDE.
You can install released versions of KubeRNP from PyPI.
pip install kubernp
If you need the current development version of KubeRNP, install it from the git repository:
pip install git+https://github.com/hackinsdn/kubernp@main
Due to the number of dependencies, we recommend installing KubeRNP in a virtual environment.
NOTE: This package has been tested and verified to work with Python versions 3.11+
Once installed, you can use KubeRNP in your Python projects:
from kubernp import KubeRNP

kubernp = KubeRNP()
kubernp.show_config()

exp = kubernp.create_experiment(name="my-webserver-experiment")
testweb = exp.create_deployment(name="testweb", image="nginx:latest", publish=[80])
testweb.exec("echo '<h1>Hello World</h1>' > /usr/share/nginx/html/index.html")

# get URL from endpoints
endpoints = testweb.get_endpoints()

# using the requests lib to simulate a client browser
import requests
requests.get("http://" + endpoints["80-tcp"][0]).text

# you can list the experiments:
kubernp.list_experiments()

# load another experiment and its resources:
existing_exp = kubernp.load_experiment("another-existing-exp")
existing_exp.list_resources()
another_dep = existing_exp.get_resource("Deployment/another")
another_dep.exec("whoami")

kubernp.delete_experiment("another-existing-exp")
Create a Pod with nodeAffinity and upload files.
>>> from kubernp import KubeRNP
>>> kubernp = KubeRNP()
>>> exp = kubernp.create_experiment()
>>> pod1 = exp.create_pod("pod1", image="debian:11", command=["/usr/bin/tail", "-f", "/dev/null"], node_affinity="whx-ba")
>>> pod1.upload_files("./misc/scripts")
Uploading: 100.00% (0.02 MB / 0.02 MB) @ 26.82 MB/s
Upload completed! Saved to /uploads

>>> print(pod1.exec("ls -la /uploads"))
total 12
drwxrwxrwx 3 root root    4096 Dec 27 08:31 .
drwxr-xr-x 1 root root    4096 Dec 27 08:30 ..
drwxr-xr-x 2  501 dialout 4096 Dec 27 08:31 scripts

# You can also define affinity by providing a inline JSON manifest part to be merged:

>>> p2 = exp.create_pod(
        "pod2",
        image="debian:11",
        command=["/usr/bin/tail", "-f", "/dev/null"],
        overrides={
            "spec": {
                "affinity": {
                   "nodeAffinity": {'requiredDuringSchedulingIgnoredDuringExecution': {
                      "nodeSelectorTerms": [{'matchExpressions': [{
                          'key': 'kubernetes.io/hostname',
                          'operator': 'In',
                          'values': ['whx-rj01'],
                      }]}]
                   }}
                }
            }
        }
    )
A typical IoT architecture for environmental monitoring involves devices like Raspberry Pi as sensor nodes, a Mosquitto MQTT broker for communication, a data processing/storage layer, and a Grafana dashboard for visualization. This example will demonstrate how to set up such a scenario. The figure below illustrates the example.
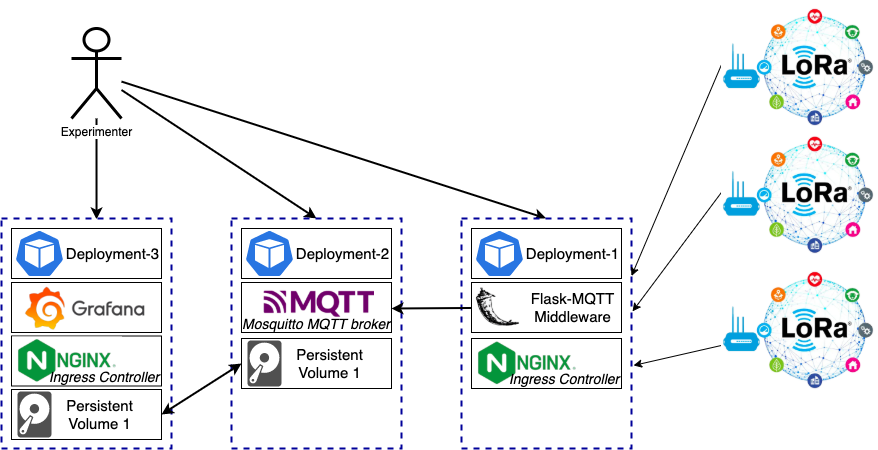
One can leverage the KubeRNP library to set up the scenario above:
$ python3

from kubernp import KubeRNP
kubernp = KubeRNP(kubeconfig="~/.kube/config-other-cluster")

exp = kubernp.create_experiment("grafana-mqtt-exp")

mqtt_broker = exp.create_deployment(
    name="mosquitto",
    image="eclipse-mosquitto:2.0.15",
    publish=[{"port": 1883, "type": "ClusterIP"}],
    configmap={
        "name": "mosquitto-config",
        "literals": {"mosquitto.conf": "listener 1883 0.0.0.0\nallow_anonymous true\nlog_dest stdout\npersistence true\npersistence_location /mosquitto/data/"},
        "mount_path": "/mosquitto/config/mosquitto.conf",
        "mount_subpath": "mosquitto.conf"
    },
    pvc={
        "name": "pvc-grafana-mqtt",
        "storage_request": "1Gi",
        "mount_path": "/mosquitto/data",
        "mount_subpath": "mosquitto"
    },
)

grafana = exp.create_deployment(
    name="grafana-mqtt",
    image="grafana/grafana:latest",
    publish_http=[{"service_port": 3000, "host": "grafana-mqtt.k8s-testing.amlight.net", "enable_tls": True}],
    pvc={
        "name": "pvc-grafana-mqtt",
        "mount_path": "/var/lib/grafana",
        "mount_subpath": "grafana"
    },
    init_command="chown 472 /var/lib/grafana"
)

flaskapp = exp.create_deployment(
    name="flask-app",
    image="python:3.11",
    publish_http=[{"service_port": 5000, "host": "flask-mqtt-middleware.k8s-testing.amlight.net"}]
)

# wait a few minutes and check for the resources

exp.list_resources()

# You will notice that the flaskapp Deployment has STATUS=0/1, which indicates the Pod
# has a problem and is not ready. Let's check the Pods for our Experiment:

exp.list_pod()

# You will notice that the flaskapp Pod has a CrashLoopBackOff state, which is not good!
# The problem is that we didn't add the command/args, so that the container won't do anything!
# We left that on purpose to demonstrate the deployment update. Let's fix it:

k8s_obj = flaskapp.get_k8s()
k8s_obj.spec.template.spec.containers[0].command = ["sleep"]
k8s_obj.spec.template.spec.containers[0].args = ["infinity"]
flaskapp.update_k8s(k8s_obj)

# wait a few seconds and check for the resources

exp.list_resources()

# Now the flask-app Deployment should report STATUS=1/1!
# Let's continue to set up the Flask-MQTT middleware

print(flaskapp.exec("pip install flask flask-mqtt"))

flaskapp.upload_files("~/work/kubernp/misc/flask-mqtt.py")

print(flaskapp.exec("ls /uploads/"))

flaskapp.exec("python3 /uploads/flask-mqtt.py &")

print(flaskapp.exec("ps aux"))

# You should see the python3 process running our flask-mqtt.py middleware app
# Now we will do some configs on Grafana. Leave this terminal open, we will
# return to it soon
Configure Grafana to use the MQTT data source: Install the MQTT data source plugin and configure it in Grafana's UI.
Open Grafana on your web browser and enter the URL https://grafana-mqtt.k8s-testing.amlight.net (created with the NGINX Ingress as requested with the publish_http argument). You should be able to login with credentials admin / admin.
Install the MQTT Plugin: Navigate to Connections -> Add new connection -> Data sources and search for "MQTT". Click on Install to install the official MQTT Datasource for Grafana.
Once installed, configure the Data Source by clicking on "Add new data source": In the plugin settings, specify the MQTT broker's address as tcp://srv-mosquitto-clusterip:1883. The name srv-mosquitto-clusterip is the Kubernetes internal DNS name used to resolve the service name within the same namespace (the DNS resolver completes the DNS hostname with the proper FQDN for the namespace and cluster domain).
You should see a message "MQTT Connected". The next step will be creating a very basic Dashboard to visualize data. Click on the "building a dashboard" link. You will see a message "Start your new dashboard by adding a visualization", click on "Add visualization" and then choose the "grafana-mqtt-datasource (default)". For query A, enter Topic = "sensor/temperature" (this is just a topic name we will use for our test). Then save the Dashboard and click to visualize it (tip: choose "Last 30 seconds" for the time interval to see the results more clearly).
Finally, let's simulate some IoT devices reporting data to the monitoring system we just configured. You can open a new Terminal and run the following command to simulate one device sending data to the system:
curl -X POST -H 'Content-type: application/json' http://flask-mqtt-middleware.k8s-testing.amlight.net/publish -d '{"topic": "sensor/temperature", "name": "temp_sensor", "value": 28}'
Back to the Grafana Dashboard, you should see a new measurement point being displayed!
Run the following script to POST random data every one second continuously:
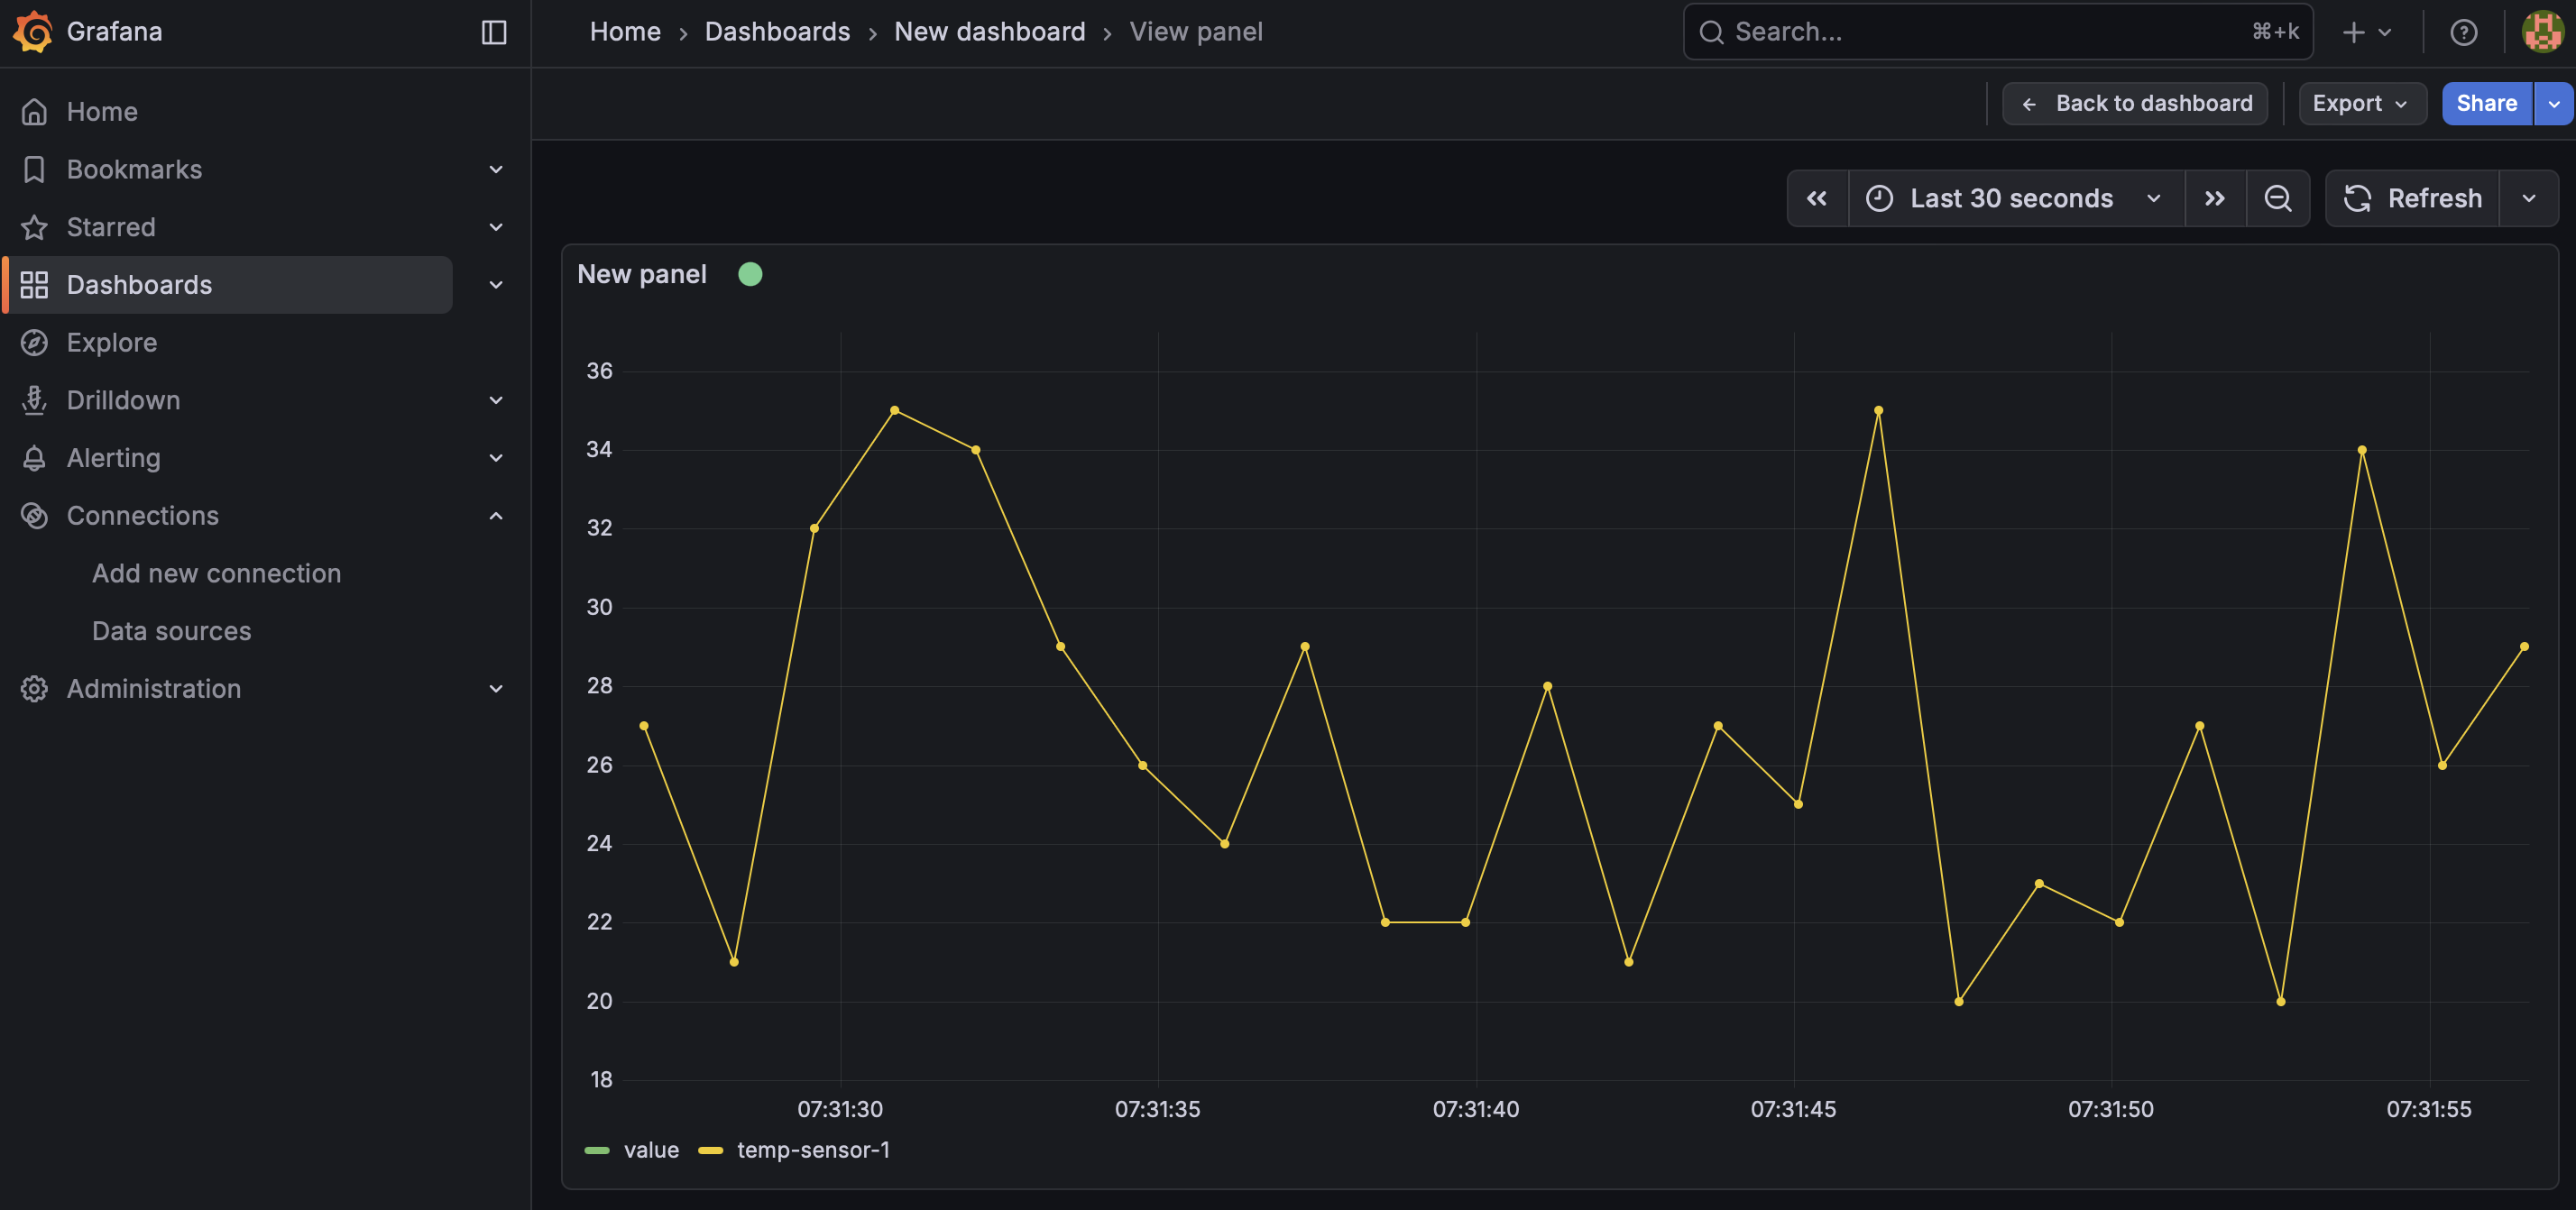
python3 ~/work/kubernp/misc/mqtt-send-data.py http://flask-mqtt-middleware.k8s-testing.amlight.net/publish
Now your Grafana Dashboard should look like:
To finish our experiment, we will delete it to release all allocated resources. On the Python console:
from kubernp import KubeRNP
kubernp = KubeRNP(kubeconfig="~/.kube/config-other-cluster")

kubernp.delete_experiment("grafana-mqtt-exp")
Disclaimer: this lab was heavily inspired from https://www.r-bloggers.com/2021/04/using-kubernetes-and-the-future-package-to-easily-parallelize-r-in-the-cloud/
The primary goal of this lab is to demonstrate the integration of the future package
in R with a Kubernetes cluster to facilitate scalable parallel computing. By transitioning from local processing to a distributed environment, the lab aims to show
how researchers can dynamically allocate resources in the Kubernetes cluster to meet the
computational demands of a task. Ultimately, the objective is to establish a flexible,
high-performance workflow that leverages Kubernetes infrastructure to overcome the hardware
limitations of a single machine.
The following image outlines the scenario and setup.
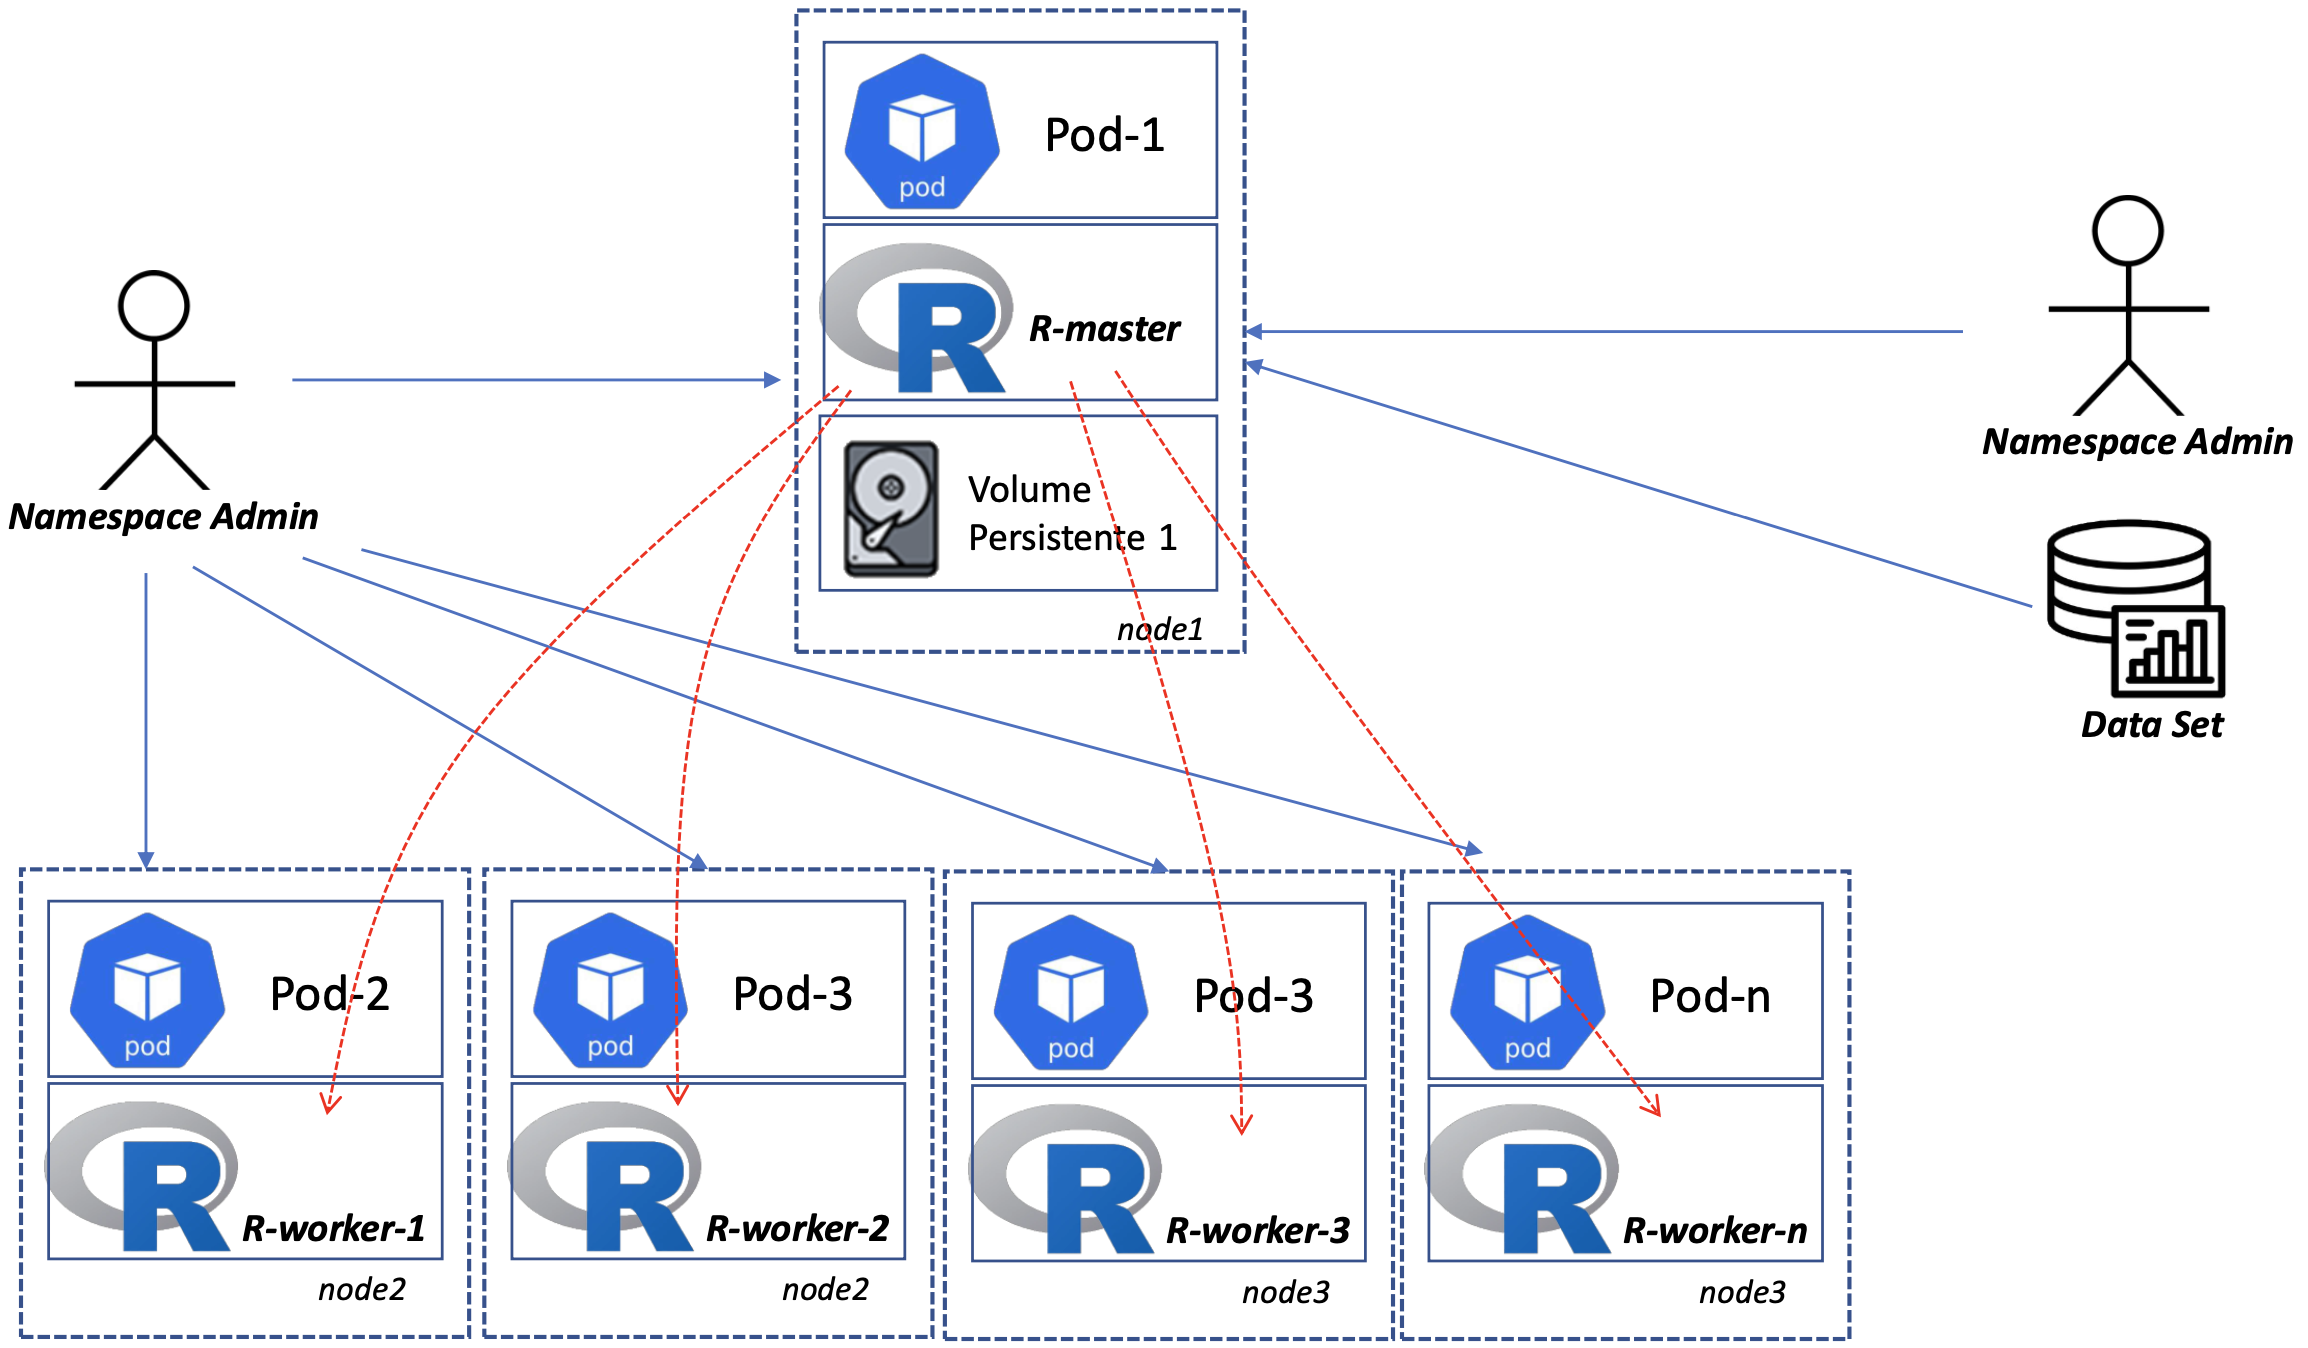
In a Kubernetes environment, the actual work is handled by pods, which function like individual Linux containers. These pods live on nodes, which are virtual machines or physical servers provided by the cloud operator. A significant benefit of this setup is resiliency: if a pod fails, Kubernetes is designed to automatically restart it, ensuring your computations continue without manual intervention. Furthermore, the most significant advantage is the massive performance gain achieved by moving from a single machine to a distributed cluster: by offloading R processing tasks to a Kubernetes cluster, you move beyond the physical limits of your local CPU and RAM.
To make that happen, the R future package can treat each pod as an individual worker. Thus, tasks
that would typically run sequentially on your laptop are executed simultaneously across dozens or
even hundreds of cloud instances.
The basic steps are:
- Set up an experiment on Kubernetes leveraging the KubeRNP library
- Start the "pods of interest" using an example provided in this tutorial
- Connect to the RStudio Server running in the Kubernetes cluster from your Internet browser
- Prepare and run the experiment
- Finish the experiment and release the resources
By "pods of interest" we mean: A) one (scheduler) pod for a primary process that runs RStudio Server
and communicates with the workers; B) multiple (worker) pods, each with one R worker process to act
as the workers. All pods will be running the Docker image rocker/rstudio:4.5.1, which is commonly
used by the community.
Let's get started:
$ python3

from kubernp import KubeRNP
kubernp = KubeRNP(kubeconfig="~/.kube/config-other-cluster")

exp = kubernp.create_experiment("r-future-exp")
We will start by checking the Kubernetes cluster to make sure the nodes are healthy and can run our jobs (this can take a few seconds because it will run a actual job on each node to guarantee it is fully operational):
healthy, unhealthy = kubernp.healthcheck_nodes()
Now that we have the list of healthy nodes, we can use the Kubernetes Node Affinity feature to run our experiment on those nodes:
exp.create_from_file("misc/r-future-cluster.yaml", node_affinity=healthy)
exp.list_resources()
You should see a list of resources that were created based on the manifest provided as an example (misc/r-future-cluster.yaml):
>>> exp.list_resources()
NAME                              UID                                   AGE    STATUS
--------------------------------  ------------------------------------  -----  --------
Deployment/future-scheduler       e4c48b09-afef-4413-a8f9-27e33bcf0c68  19s    1/1
Deployment/future-worker          6f2c0369-6ffe-49ac-820e-83d1232cd8d1  18s    4/4
Service/future-scheduler-master   b580d01c-e0bf-45ca-b876-4dcd7351163f  17s    --
Service/future-scheduler-rstudio  47371808-34d9-4f7f-8127-d0c921b2dae4  17s    --
Run the following command to get the URL that you will open your Internet browser to actually run the R experiment:
>>> exp.get_endpoints()
{'future-rstudio': ['200.159.252.130:32744']}
Note: you can also combine the Ingress feature as we demonstrated on previous example to have a nice URL with https on standard ports, rather than http on 32690 (which can be subject to firewall restrictions on many organizations).
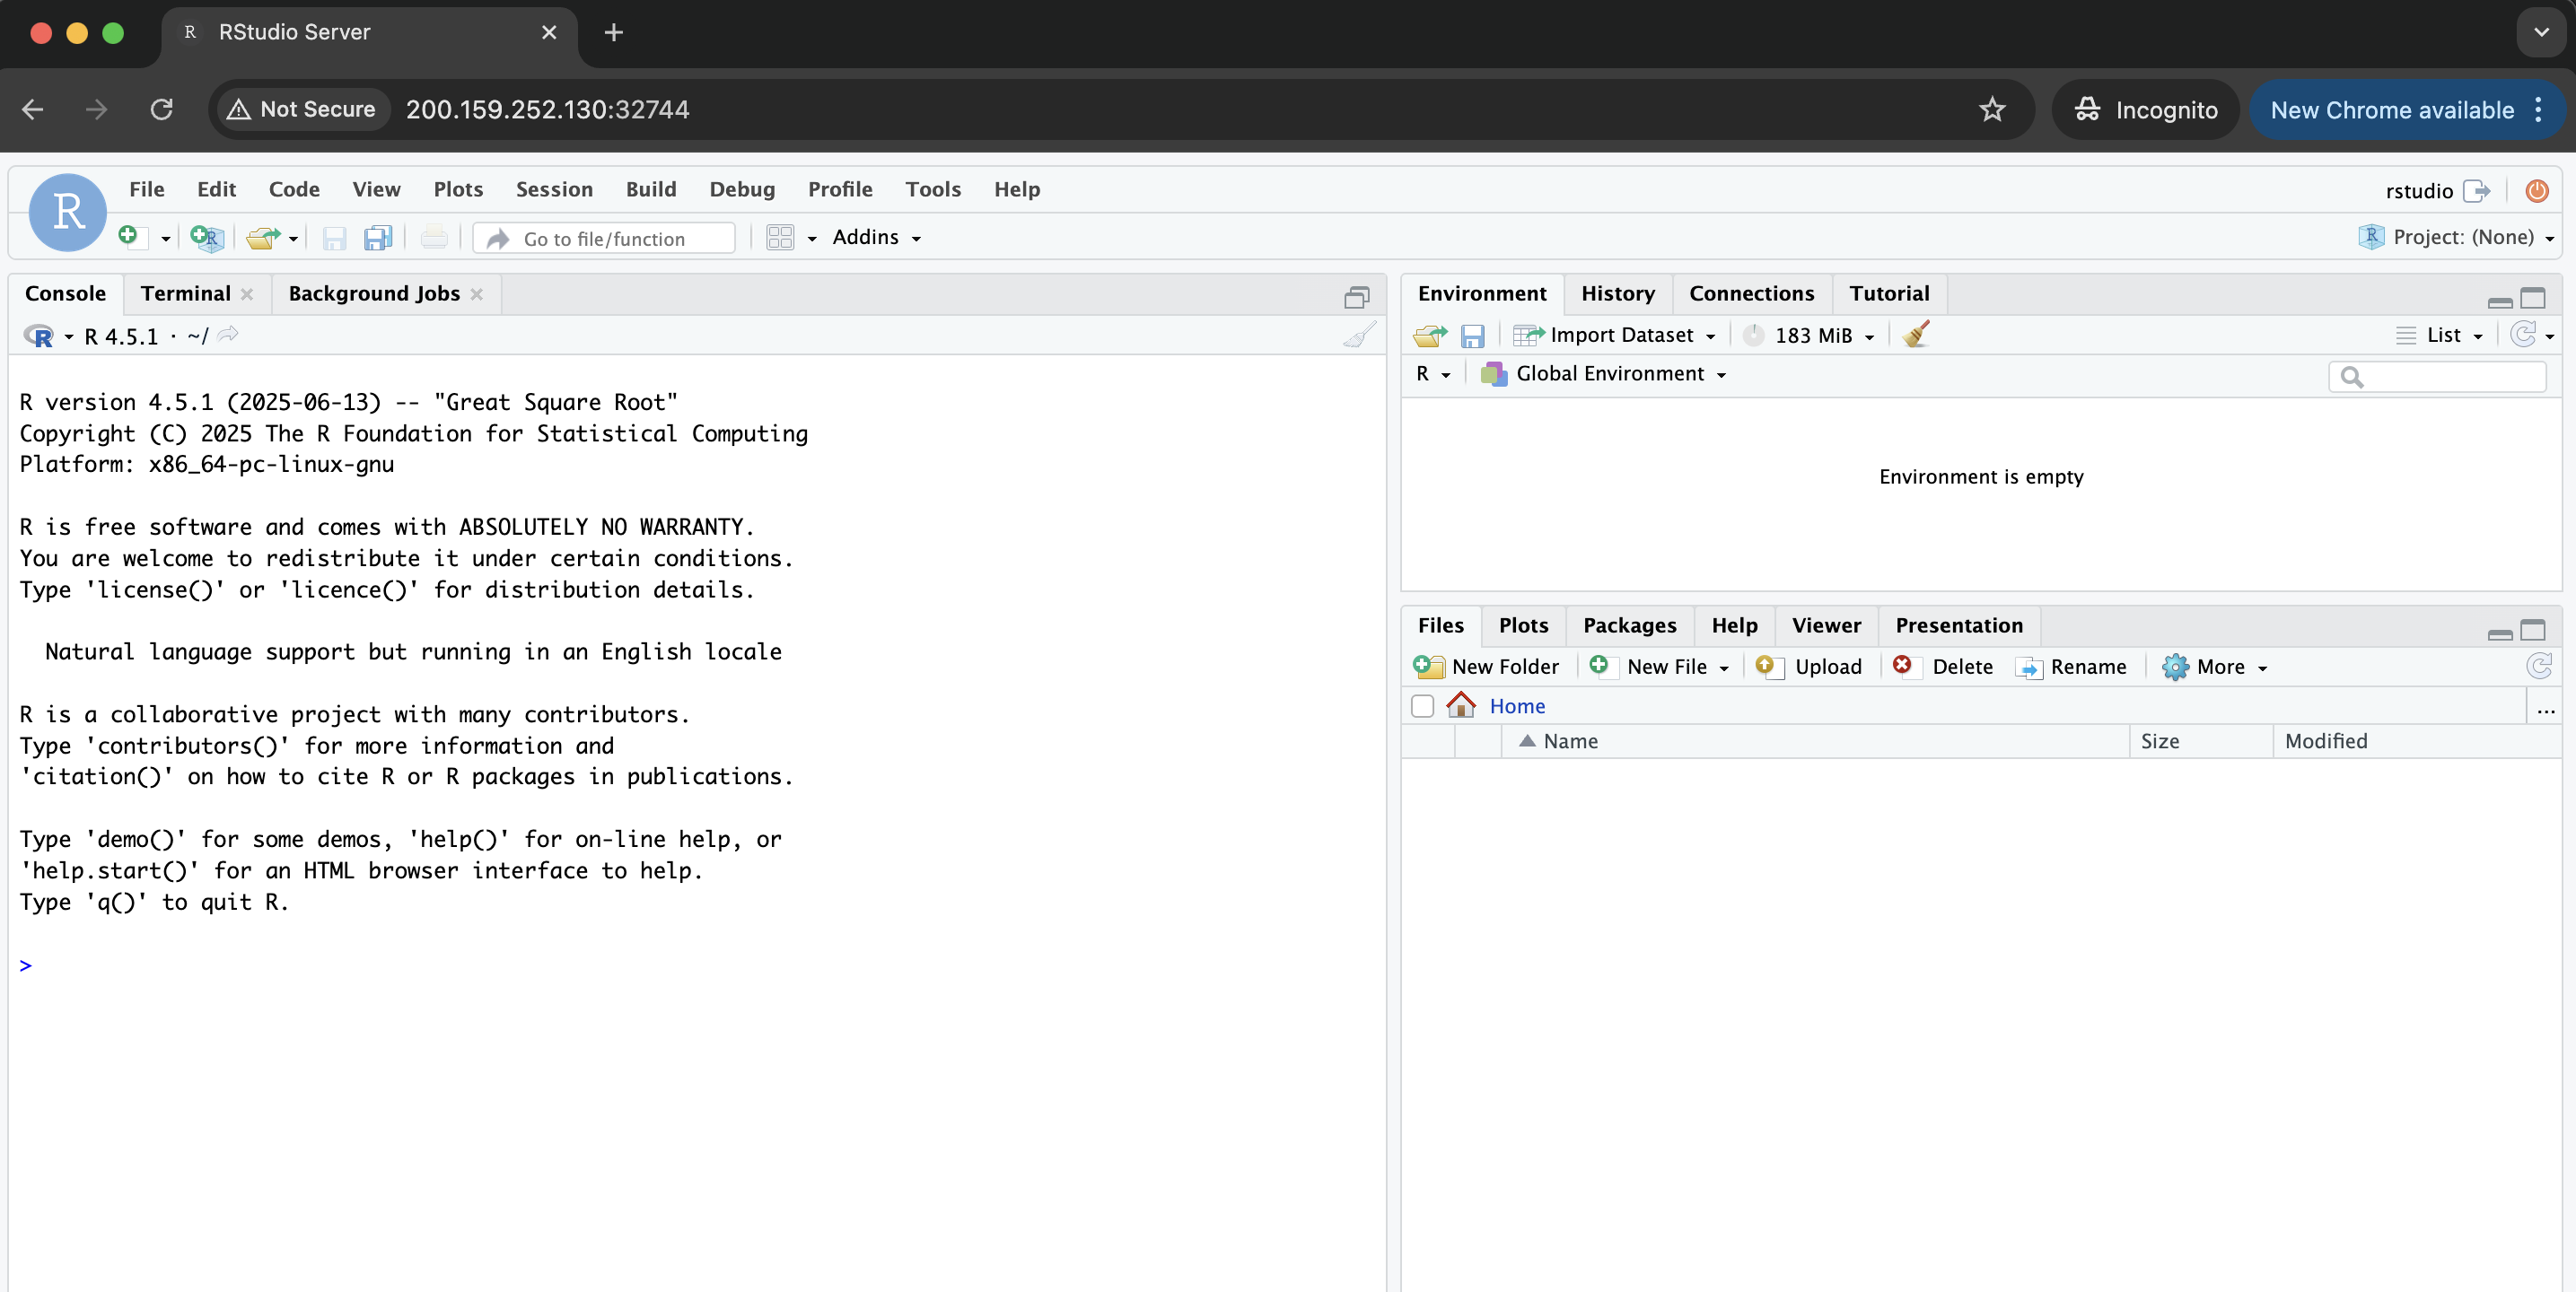
Open the address returned (i.e, http://200.159.252.130:32744) on your Internet browser. If asked for username and password you can use: username - rstudio and password - future. You should see an image like this:
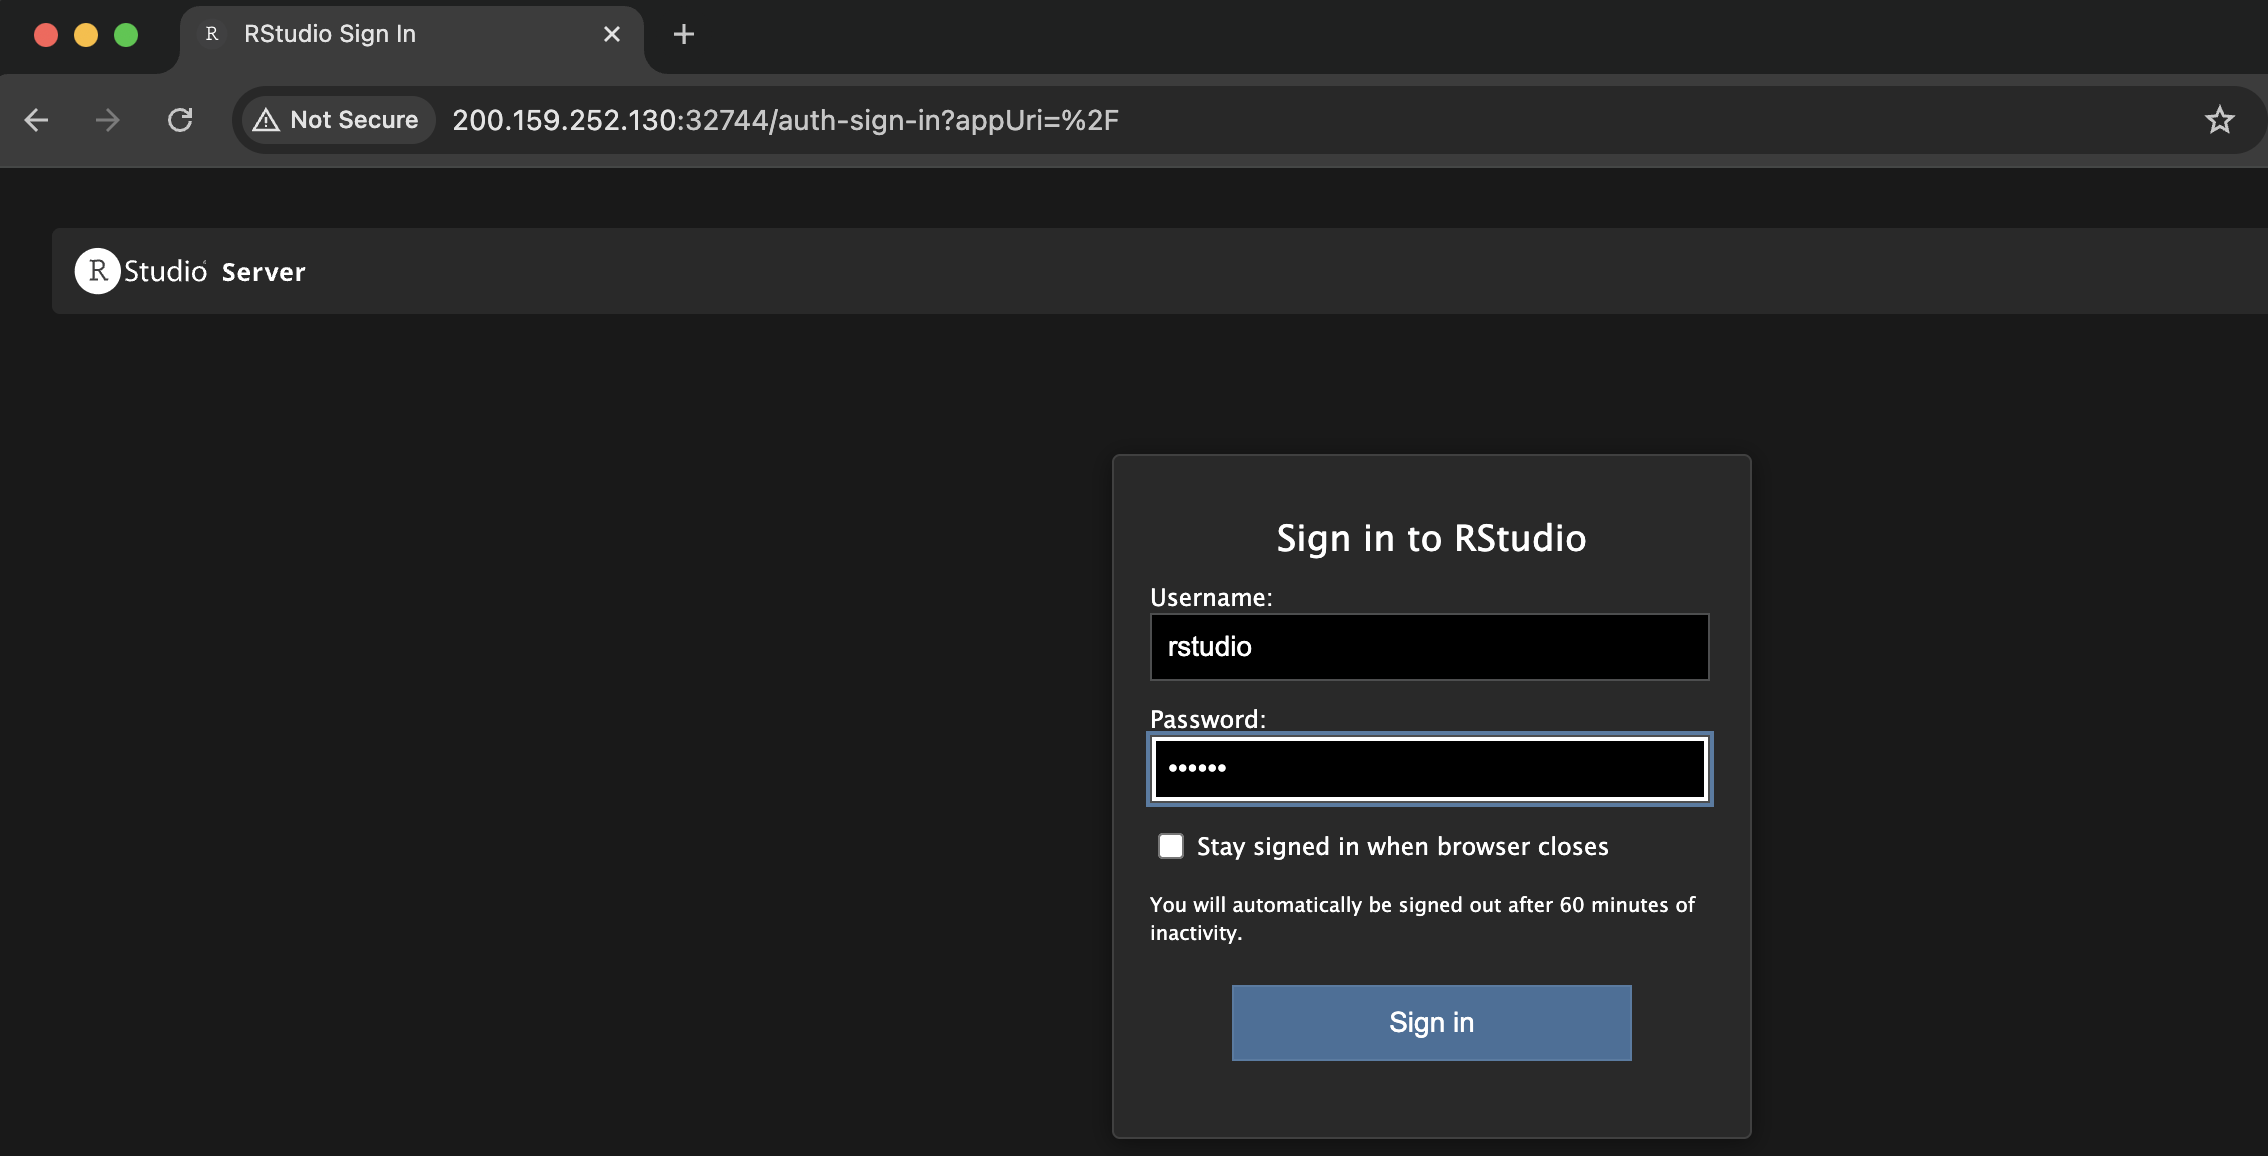
And after login, you should see this:
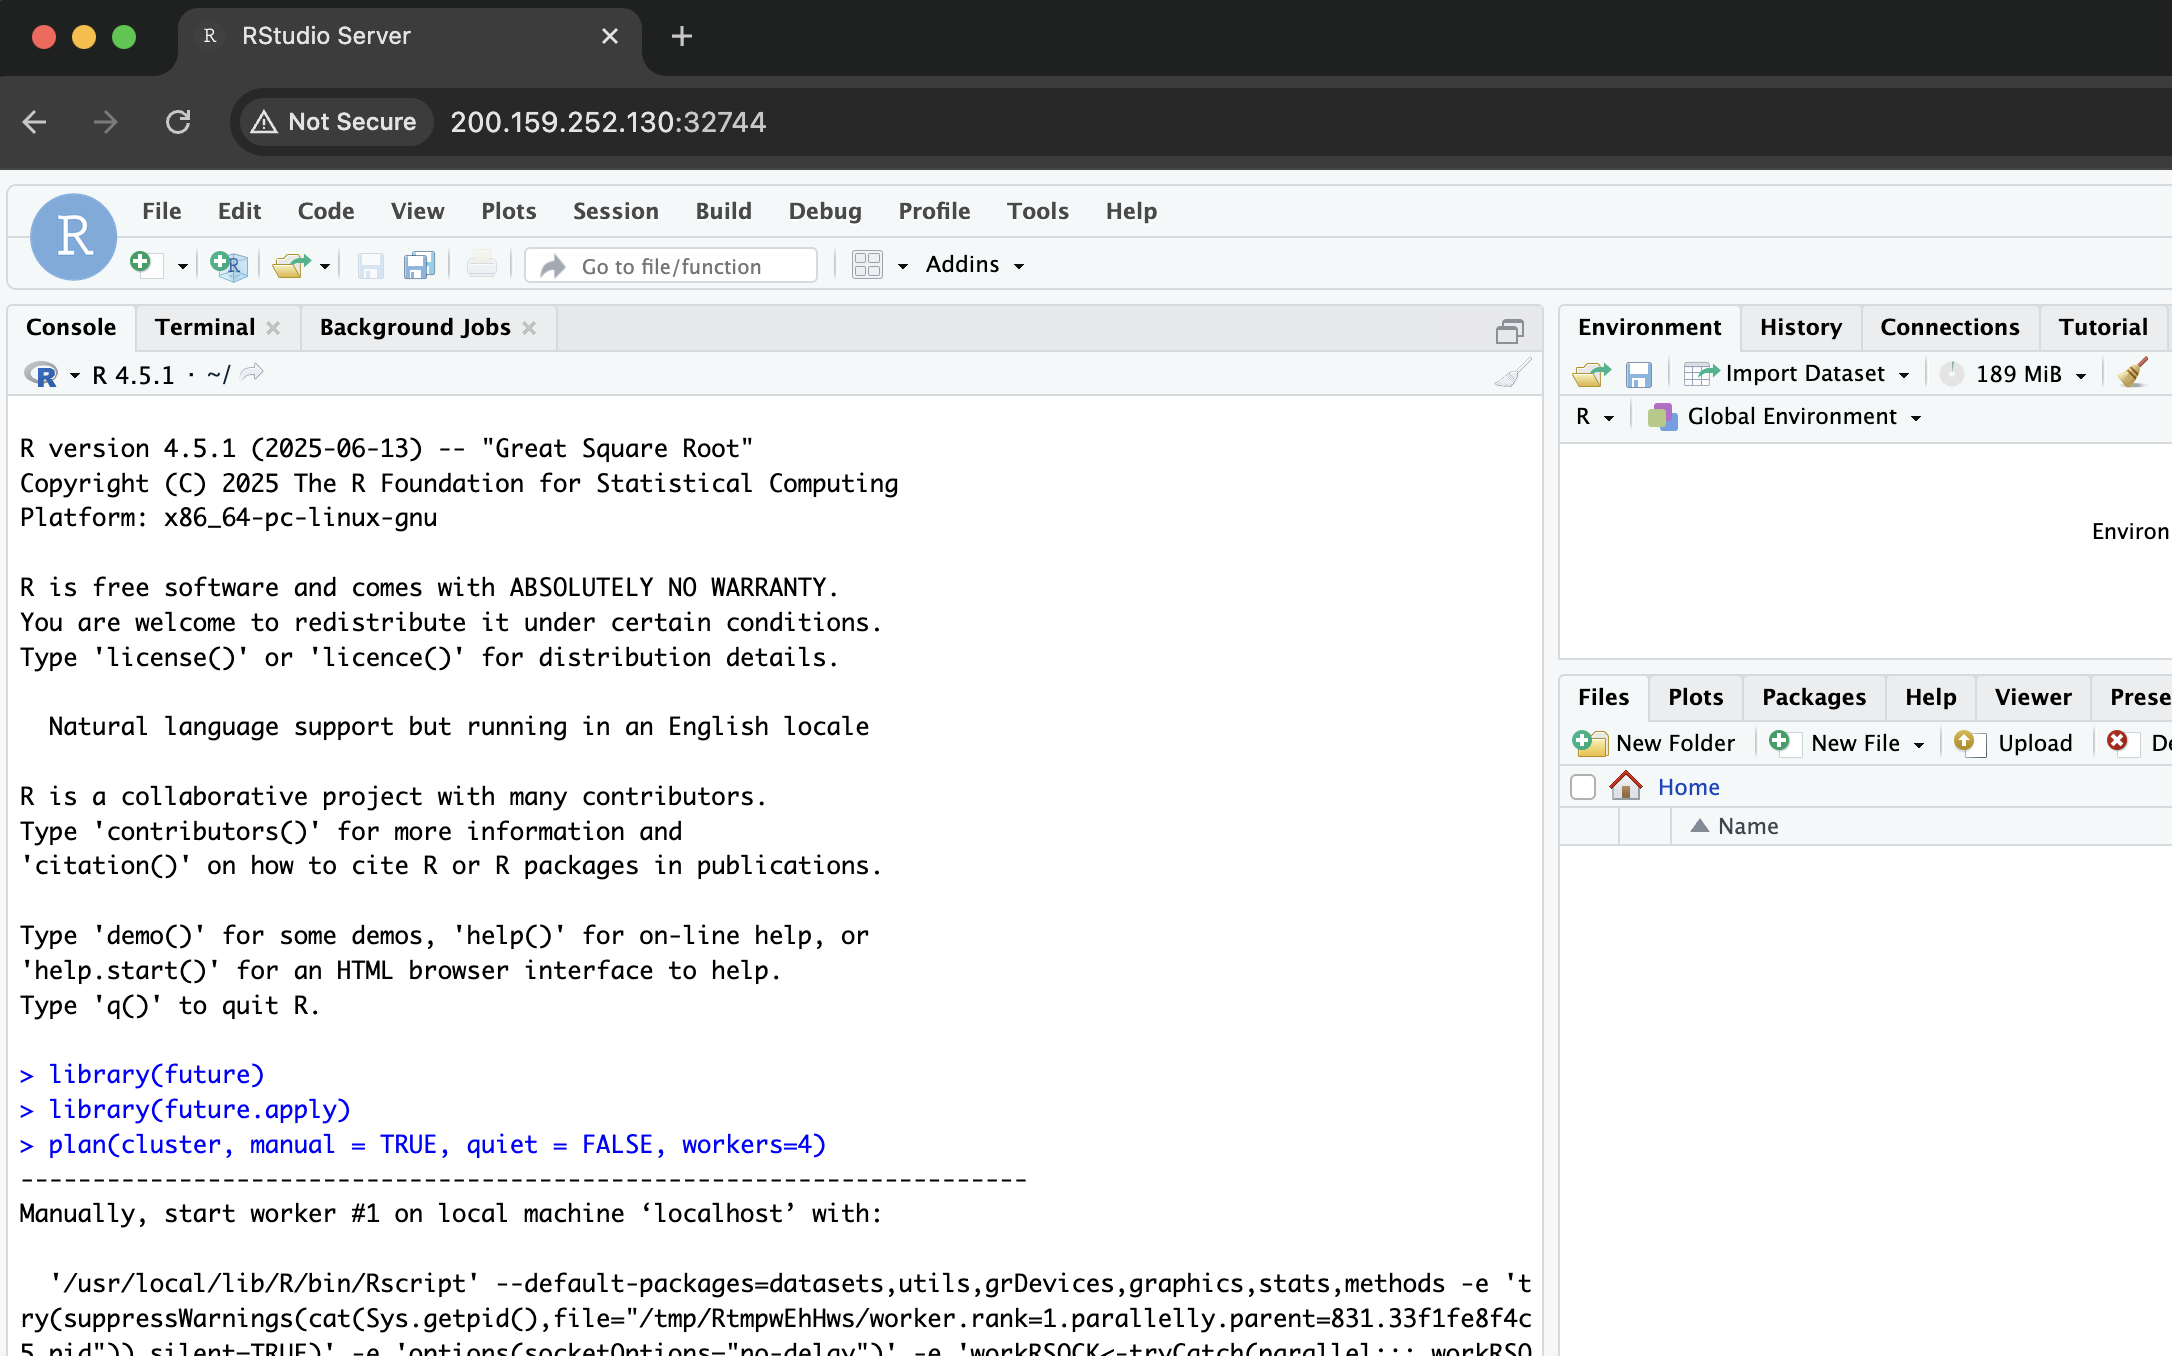
Now, on the RStudio console, let's start by importing the libraries we will use:
library(future)
library(future.apply)
Next, we will create a plan for the experiment, leveraging the remote workers to compose our cluster:
plan(cluster, manual = TRUE, quiet = FALSE, workers=4)
The parameter manual = TRUE above plays a vital role in preventing the future package from
attempting to launch new R processes on the workers. The parameter is necessary because Kubernetes has already initialized these processes, which are currently idling and waiting to establish a
connection with the primary RStudio Server instance. With the parameter workers=4, we set up the plan to wait for 4 workers to connect. Finally, quiet=FALSE helps us see what is being
executed.
You should see an output like this:
After a few seconds, you can run the following command to check if all workers are running:
nbrOfWorkers()
future_sapply(seq_len(nbrOfWorkers()), function(i) Sys.info()[["nodename"]])
You should see the number of workers equals 4 and the name of each pod:
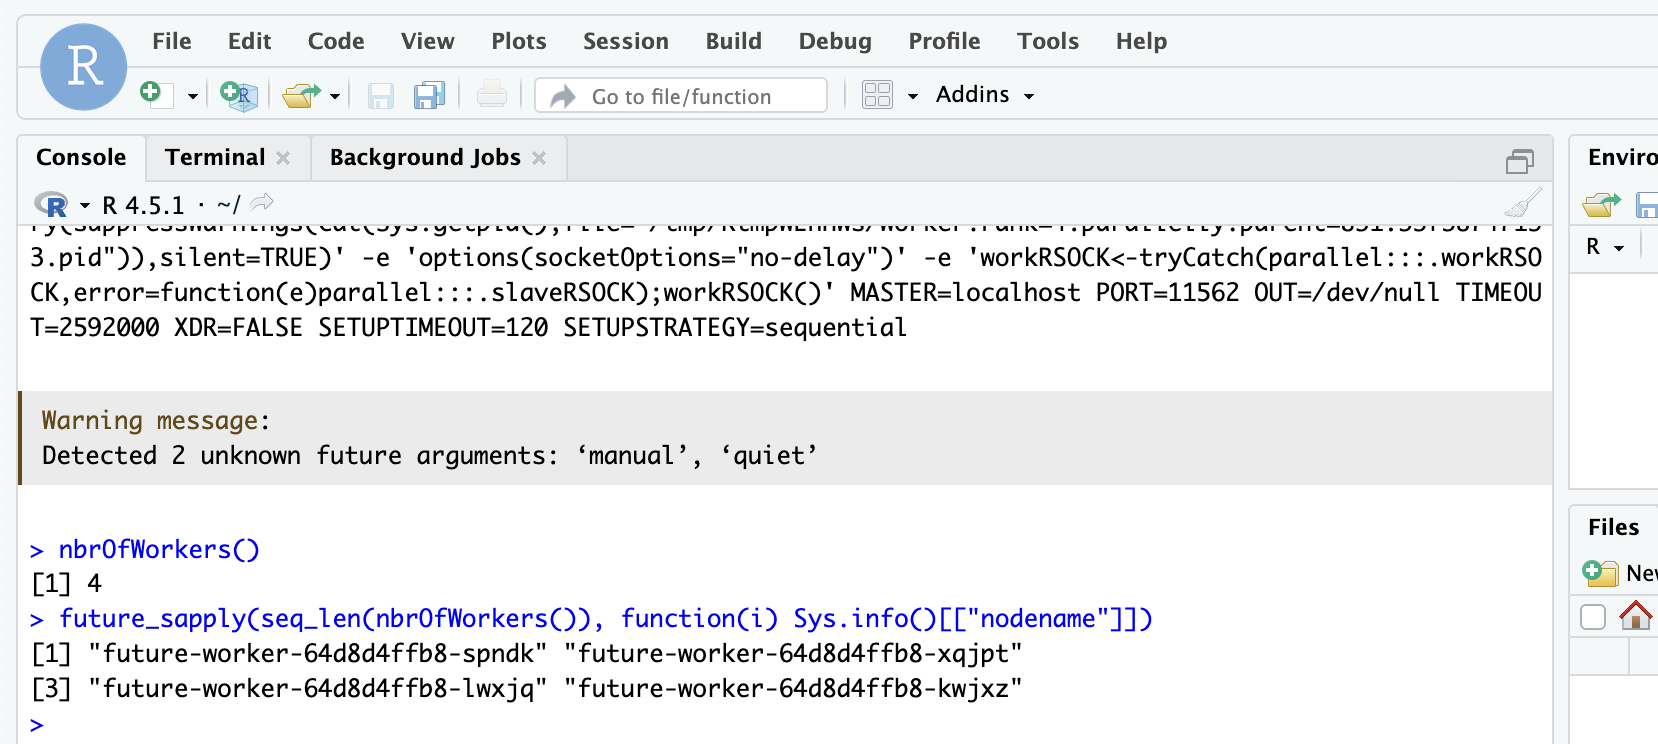
Notice that the workers' names match the names of the pods we created. You can confirm that by running the following command on the Python console we started earlier:
>>> exp.list_pod()
KIND/NAME                             STATUS    AGE    NODE    IP
------------------------------------  --------  -----  ------  -------------
Pod/future-scheduler-dcc577d46-lr5cg  Running   15m    ids-rj  10.50.24.2
Pod/future-worker-64d8d4ffb8-kwjxz    Running   15m    ids-rn  10.50.124.182
Pod/future-worker-64d8d4ffb8-lwxjq    Running   15m    whx-rn  10.50.22.203
Pod/future-worker-64d8d4ffb8-spndk    Running   15m    ids-rj  10.50.24.42
Pod/future-worker-64d8d4ffb8-xqjpt    Running   15m    ids-pb  10.50.63.154
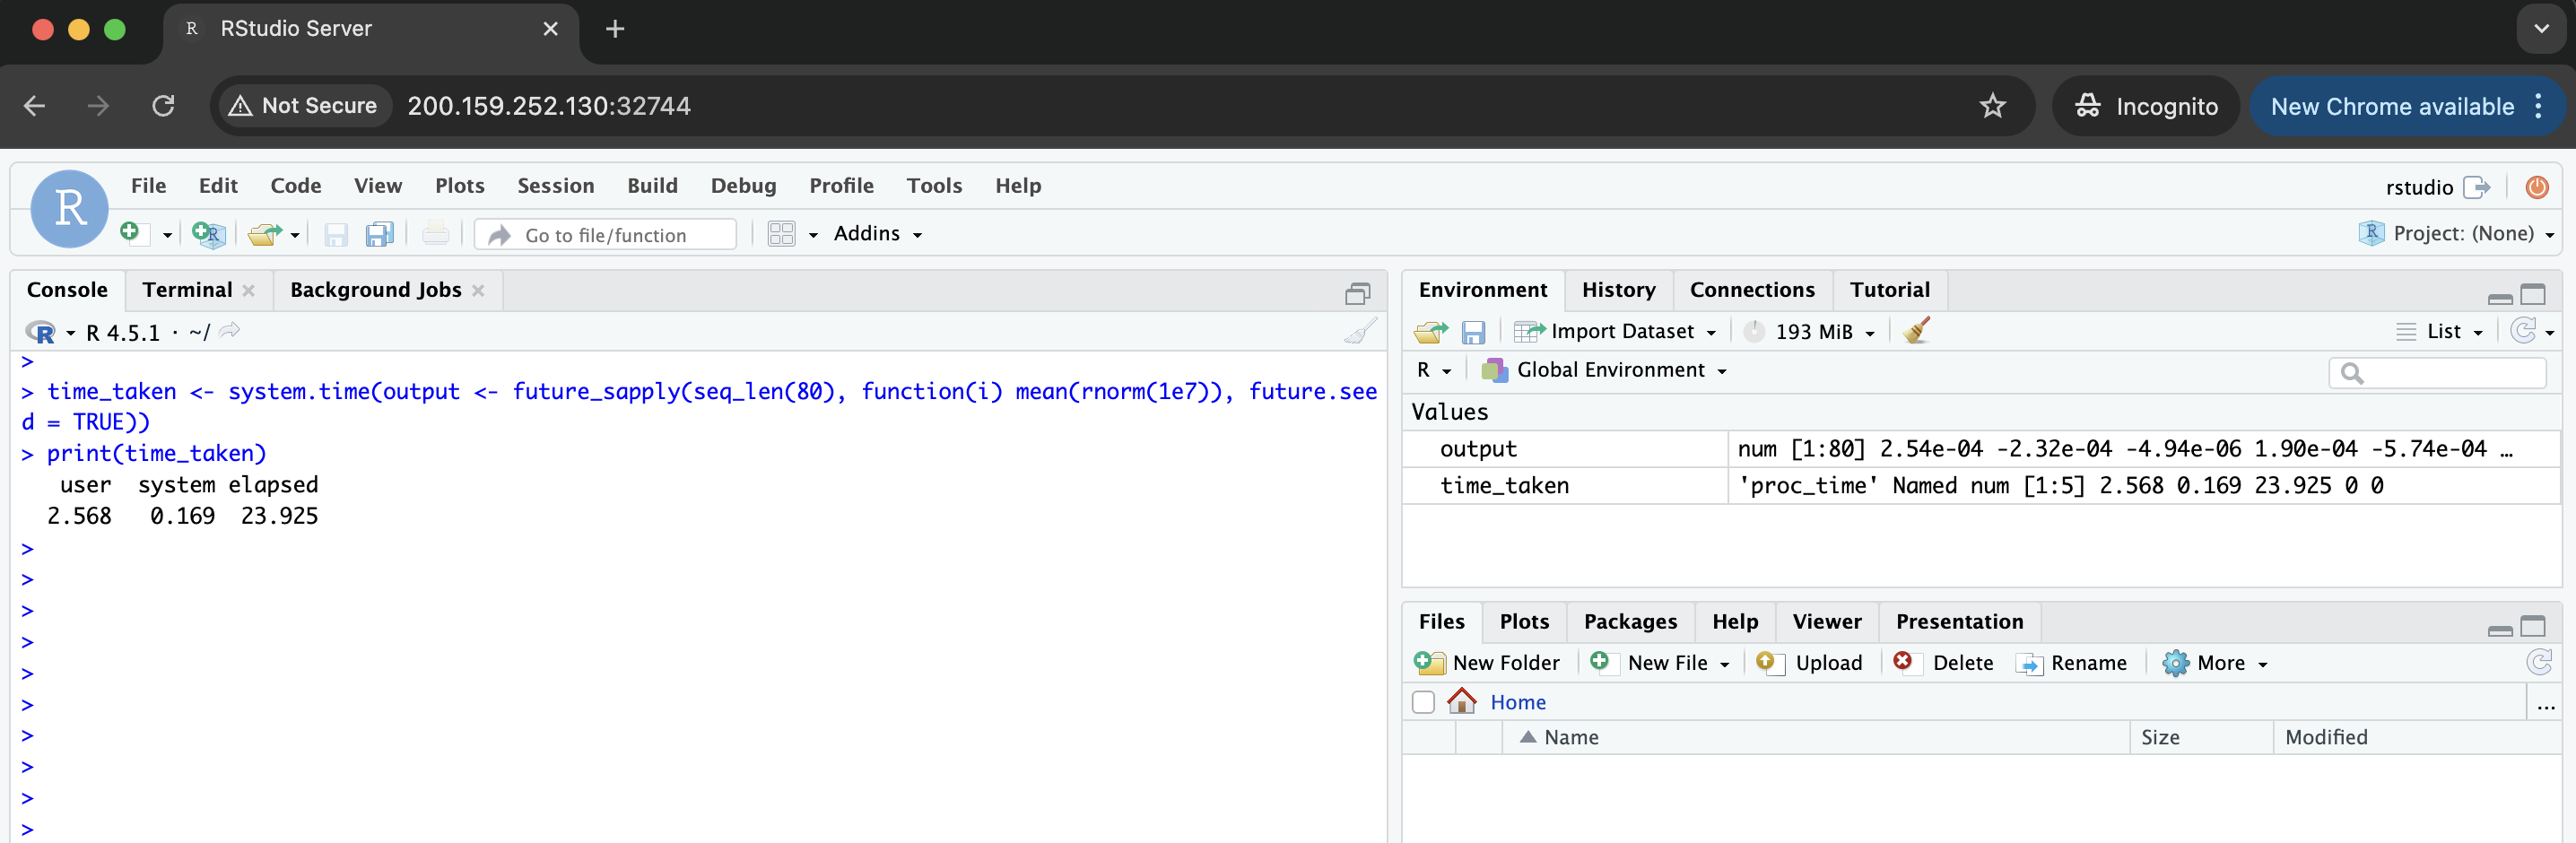
Next, we will actually run the R experiment leveraging the distributed processing. For our demonstration, we will run a straightforward calculation: the mean of 10 million random numbers, 80 times in parallel (we will also measure the time taken for comparison purposes). On your browser running RStudio:
time_taken <- system.time(output <- future_sapply(seq_len(80), function(i) mean(rnorm(1e7)), future.seed = TRUE))
print(time_taken)
You should see this:
Finally, just for the sake of comparison, we can run the same experiment in a sequential strategy to check how long it will take:
plan(sequential)
time_taken2 <- system.time(output <- future_sapply(seq_len(80), function(i) mean(rnorm(1e7)), future.seed = TRUE))
print(time_taken2)
Expected output:
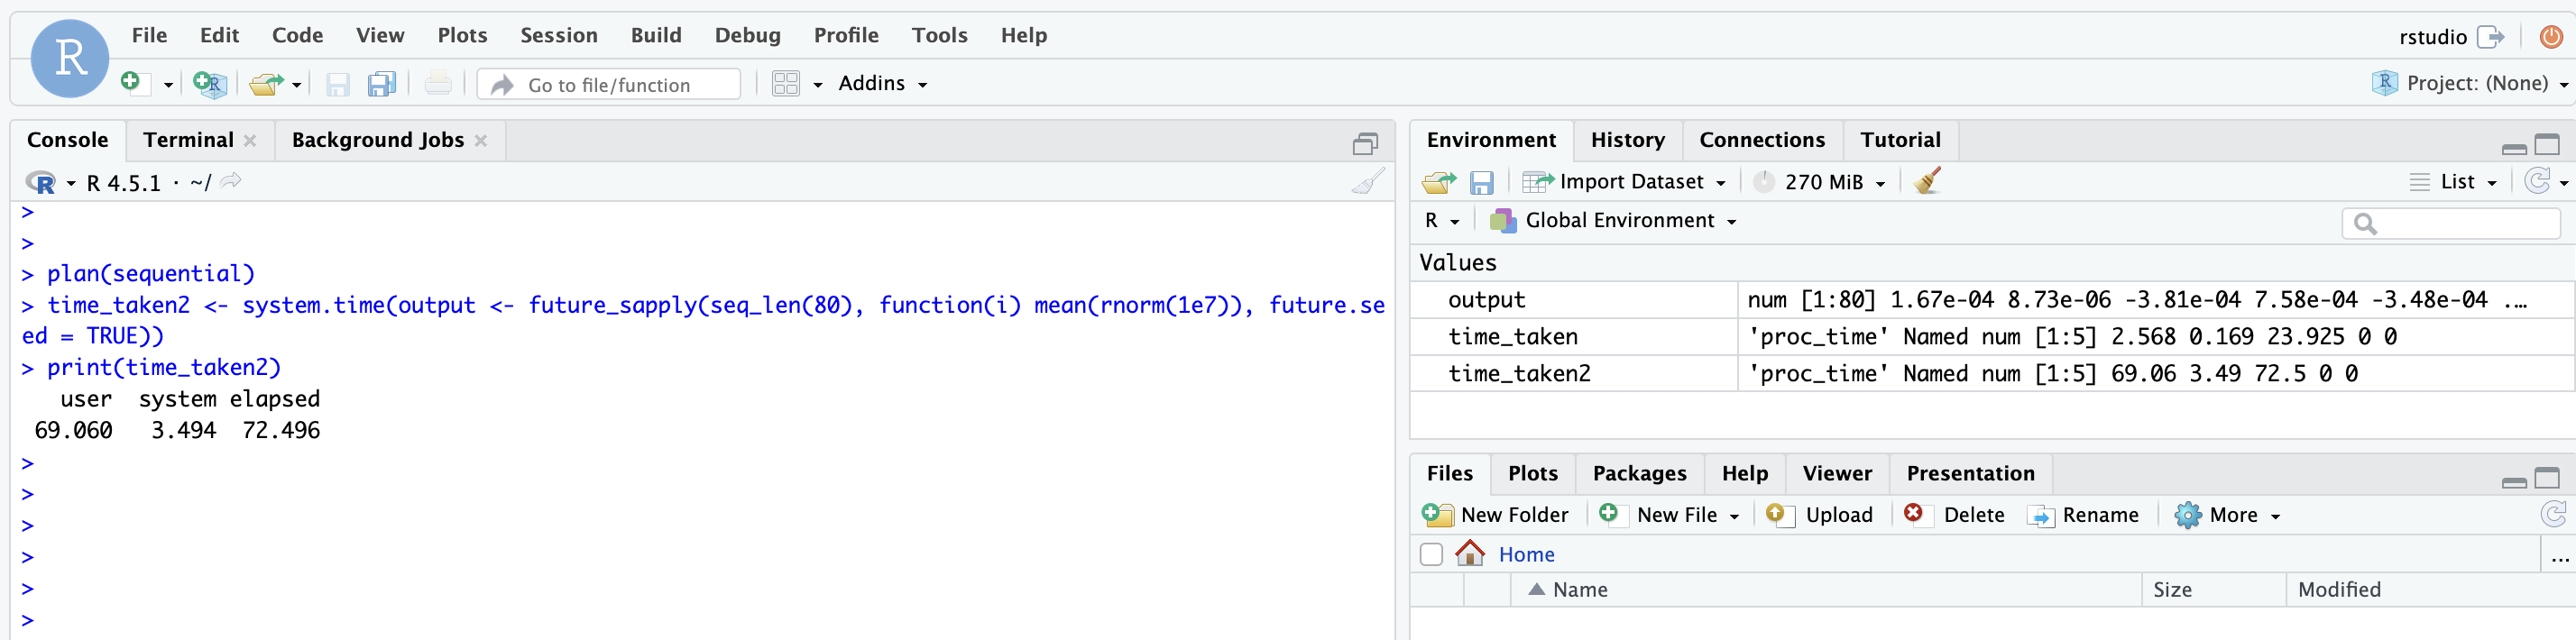
You should see that the time is much higher, which makes sense, since we compared a distributed execution with 4 workers versus a sequential execution with just one worker. One could even explore this experiment further by combining multisession and cluster parallel strategies, which will explore more cores available on each worker.
Finally, we can finish the experiment and release the resources on the Python console:
exp.finish()
This example demonstrates how to run HackInSDN Labs with Mininet-Sec, VXLAN tunnels between pods, and much more:
$ python3

from kubernp import KubeRNP
kubernp = KubeRNP(kubeconfig="~/.kube/config-other-cluster")

exp = kubernp.create_experiment()

exp.create_from_file("misc/mininet-sec/lab-scan-brute_force-dos.yaml")
After creating the experiment, we can check the resources and their status:
>>> exp.list_resources()
NAME                               UID                                   AGE    STATUS
---------------------------------  ------------------------------------  -----  --------
Secret/sec-kubeconfig-730f705cde   dcffb34f-61c9-4554-9a70-cc6bfadd394c  1m48s  --
Deployment/mininet-sec-730f705cde  e36c5fa5-4573-4a87-b60a-547434d36164  1m48s  1/1
Service/mininet-sec-730f705cde     b1a4adaf-db3b-4b29-b415-64cfb2139773  1m47s  --
Next, you can get the endpoints so that you can start using them:
>>> exp.list_endpoints()
NAME              ENDPOINT
----------------  ---------------------
http-mininet-sec  200.159.252.130:31110
https-secflood    200.159.252.130:31645
http-kytos-api    200.159.252.130:31010
With the endpoints above, you can start using the HackInSDN/Mininet-Sec Lab by following the instructions on the step-by-step lab guide and the resources hosted on the URLs above.
This example demonstrates how to run a distributed ContainerLab lab in the Kubernetes cluster, leveraging the controller Clabernetes (your Kubernetes cluster has to be configured with Clabernetes):
$ python3

from kubernp import KubeRNP
kubernp = KubeRNP(kubeconfig="~/.kube/config-other-cluster")

exp = kubernp.create_experiment()

exp.create_from_file("misc/containerlab/lab1/test-simple.clab.yml")
The commands above should run all the necessary steps to properly run a ContainerLab scenario in the Kubernetes cluster, including uploading local files to the cluster, running clabverter to convert the ContainerLab topology into Kubernetes resources, and actually provisioning those resources. If you see an error/exception like this:
>>> exp.create_from_file("misc/containerlab/lab1/test-simple.clab.yml")
Traceback (most recent call last):
...
kubernetes.dynamic.exceptions.ResourceNotFoundError: No matches found for {'api_version': 'clabernetes.containerlab.dev/v1alpha1', 'kind': 'Topology'}
That means your Kubernetes cluster does not have Clabernetes controller installed, which is required to run ContainerLab fully integrated with Kubernetes (please refer to Example 07 to have some insights on how to run ContainerLab topology with a single Pod approach, which is not recommended!).
Assuming your K8s cluster has Clabernetes installed, you can check the status of your experiment like:
>>> exp.list_resources()
NAME                                     UID                                   AGE    STATUS
---------------------------------------  ------------------------------------  -----  --------
ConfigMap/clab-a60d3bb297-h2-files       5fd07a50-9cb5-4b4d-80f5-992a527ef55c  6s     --
ConfigMap/clab-a60d3bb297-h1-files       c923ce6b-fd11-419b-8713-9d5aa8e201fb  7s     --
Topology/clab-a60d3bb297                 70176a5a-82e1-45ab-a626-e9fcce86b99d  7s     2/2
Deployment/topo-viewer-clab-a60d3bb297   dc599408-2b68-4ba1-92f4-1b634df426ba  7s     1/1
Service/topo-viewer-clab-a60d3bb297      d88d7833-8dca-4088-8ea6-8213370042a8  7s     --
ConfigMap/topology-data-clab-a60d3bb297  053b4e19-6d5d-46d5-9c22-f3791bcf7e91  6s     --

>>> exp.list_deployment()
KIND/NAME                               STATUS    AGE
--------------------------------------  --------  -----
Deployment/clab-a60d3bb297-h1           1/1       1m23s
Deployment/clab-a60d3bb297-h2           1/1       1m23s
Deployment/topo-viewer-clab-a60d3bb297  1/1       1m23s
As you can see above, you have all the resources required to run your Lab, specially the Deployments that represent the nodes of the topology: h1 and h2. When using ContainerLab in Kubernetes, each Deployment runs in a Docker-in-Docker environment, with the actual Pod running as a Docker container within it. Thus, you can run commands on h1 node with the following APIs:
>>> dep_h1 = exp.get_resource("Deployment/clab-a60d3bb297-h1")
>>> print(dep_h1.exec("docker ps"))
CONTAINER ID   IMAGE                     COMMAND           CREATED   STATUS       PORTS                     NAMES
b5658e6cc406   ghcr.io/srl-labs/alpine   "/docker-ent.…"   4h ago    Up 4 hours   0.0.0.0:60000->21/tcp...  h1
>>> print(dep_h1.exec("docker exec h1 ip link"))
1: lo: <LOOPBACK,UP,LOWER_UP> mtu 65536 qdisc noqueue state UNKNOWN mode DEFAULT group default qlen 1000
    link/loopback 00:00:00:00:00:00 brd 00:00:00:00:00:00
2: eth0@if7: <BROADCAST,MULTICAST,UP,LOWER_UP> mtu 1500 qdisc noqueue state UP mode DEFAULT group default
    link/ether 3a:be:a5:d8:92:a2 brd ff:ff:ff:ff:ff:ff link-netnsid 0
3: eth1.10@eth1: <BROADCAST,MULTICAST,UP,LOWER_UP> mtu 9500 qdisc noqueue state UP mode DEFAULT group default qlen 1000
    link/ether aa:c1:ab:00:01:01 brd ff:ff:ff:ff:ff:ff
5: eth1@if6: <BROADCAST,MULTICAST,UP,LOWER_UP> mtu 9500 qdisc noqueue state UP mode DEFAULT group default
    link/ether aa:c1:ab:00:00:01 brd ff:ff:ff:ff:ff:ff link-netnsid 0
You can also leverage the KubeRNP library to open an interactive shell with the Pod (run the following commands in another terminal):
$ export KUBECONFIG=~/.kube/config-other-cluster

$ python3 -m kubernp list pod
KIND/NAME                                         STATUS    AGE    NODE         IP
------------------------------------------------  --------  -----  -----------  ------------
Pod/clab-a60d3bb297-h1-5fc48547c4-2rvq9           Running   4h     k8s-testing  10.97.108.72
Pod/clab-a60d3bb297-h2-6474488559-f6zdz           Running   4h     k8s-testing  10.97.108.80
Pod/topo-viewer-clab-a60d3bb297-54656bbd77-x57nb  Running   4h     k8s-testing  10.97.108.71

$ python3 -m kubernp shell Pod/clab-a60d3bb297-h1-5fc48547c4-2rvq9

[*]─[h1]─[/clabernetes]
└──> docker ps
CONTAINER ID   IMAGE                     COMMAND           CREATED   STATUS       PORTS                     NAMES
b5658e6cc406   ghcr.io/srl-labs/alpine   "/docker-ent.…"   4h ago    Up 4 hours   0.0.0.0:60000->21/tcp...  h1
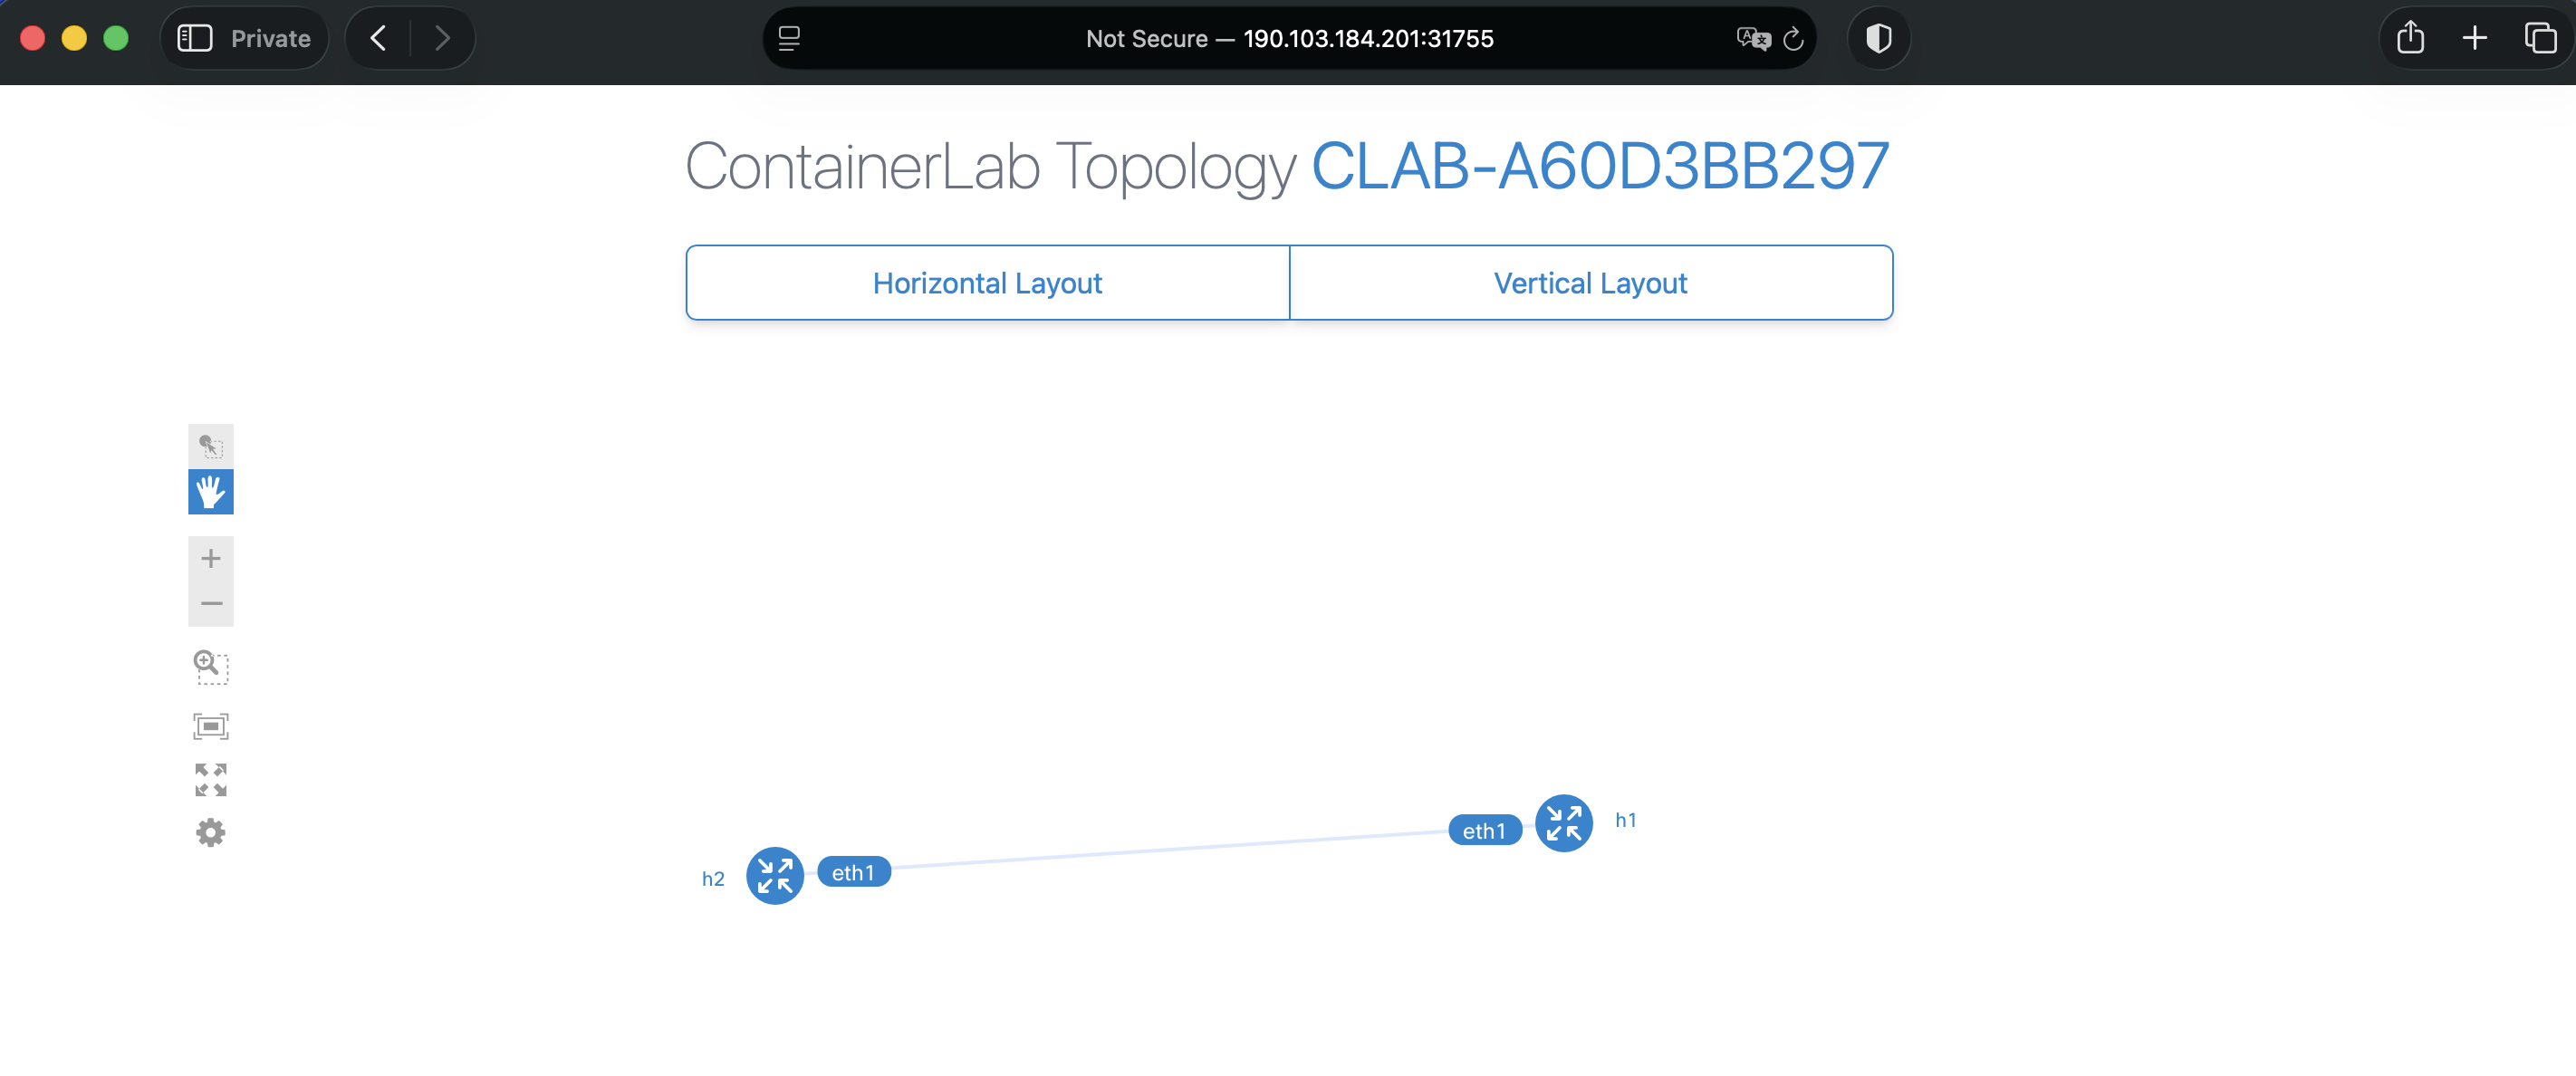
You can also view the topology using the "topology visualizer" container that was created. For that, you need to get the endpoint for the topology visualizer back on the Python console:
>>> exp.list_endpoints()
NAME                      ENDPOINT
------------------------  ---------------------
http-topology-visualizer  190.103.184.201:31755
Now you can open your Internet browser to http://190.103.184.201:31755 (the address from the previous command). You should have access to a topology similar to that displayed below:
In many scenarios, the Docker image used for your ContainerLab labs has many restrictions defined by the software vendor. Some of those restrictions can be addressed by using the license approach provided by ContainerLab. You may need to run a private Docker image in your lab and ensure no one else can run it. This example demonstrates how to do it.
$ python3

from kubernp import KubeRNP
kubernp = KubeRNP(kubeconfig="~/.kube/config-other-cluster")

exp = kubernp.create_experiment()
We will first start by creating a Secret that stores our private Tokens to download the Docker image from our registry:
exp.create_secret_docker_registry(name="secret-img-pull", registry_url="docker.io", username="xptofoobar", password=None, secret_key="config.json")
Most of the parameters above are self-explanatory, but one that deserves attention is the password=None. This parameter, of course, should contain the private Token, but when you pass the value None, it will securely prompt for your password on the command line.
Next, you can load your ContainerLab topology and provide the Secret name created before:
exp.create_from_file("misc/containerlab/lab4-secrets/test-secrets.clab.yml", image_pull_secret="secret-img-pull")
Please note that, currently, Clabernetes only supports one secret to be used for all private images. Although you can work around this by either i) designing your experiment so that all private images are hosted under the same secret, or ii) manually editing the Deployments and mounting the specific secrets (not practical), we have plans to enhance this feature in future work.
If you don't have Clabernetes controller installed on your Kubernetes cluster, you can still use ContainerLab on the cluster. Still, you won't benefit from the distributed environment, as the topology isn't spread across different nodes and pods. If that is fine for you, this example will guide you through the process.
First step, as usual, is to set up an experiment:
$ python3

from kubernp import KubeRNP
kubernp = KubeRNP(kubeconfig="~/.kube/config-other-cluster")

exp = kubernp.create_experiment()
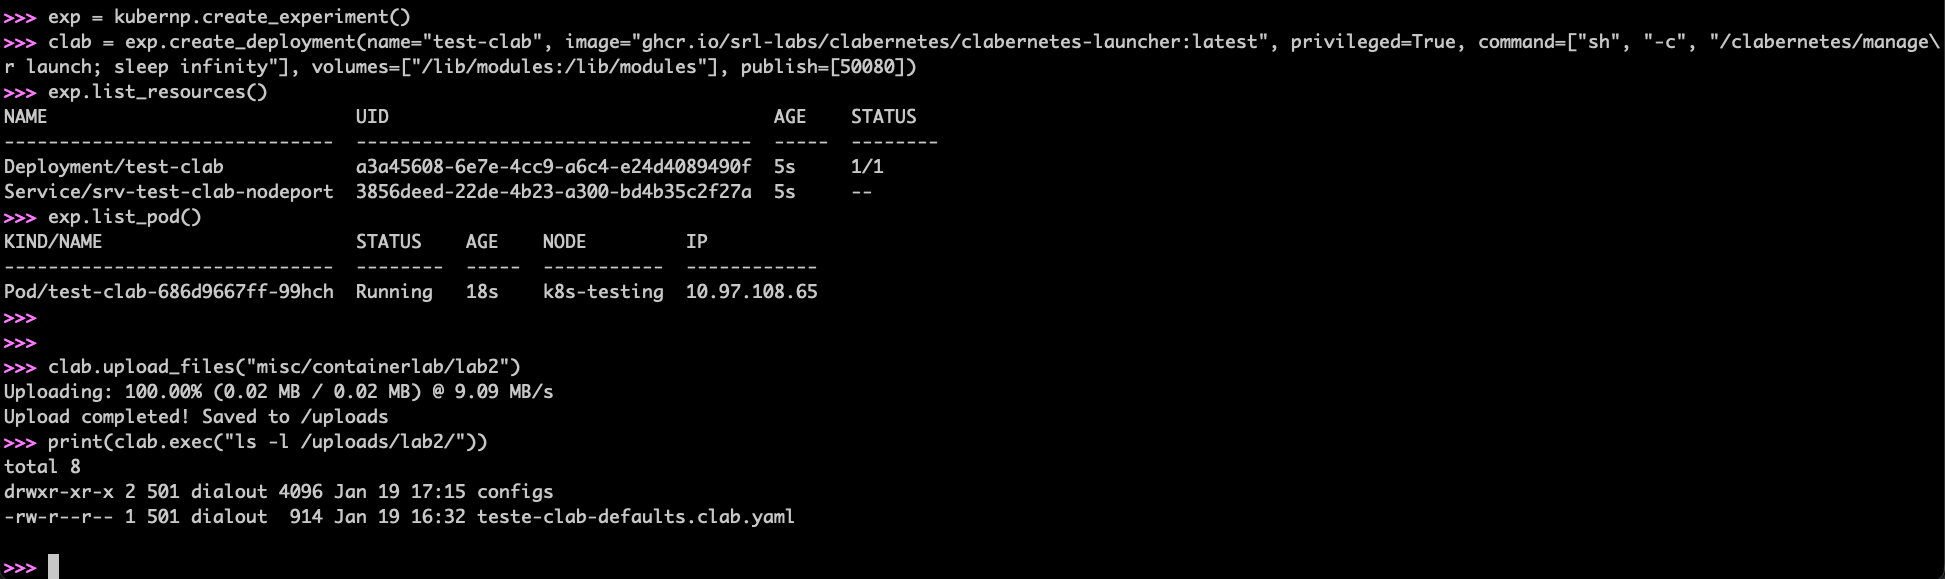
Next, you can create a Deployment to run your Lab. We will leverage the Clabernetes Docker image to run our Deployment just for simplicity. We will also publish a port that can be used to visualize the topology:
clab = exp.create_deployment(name="test-clab", image="ghcr.io/srl-labs/clabernetes/clabernetes-launcher:latest", privileged=True, command=["sh", "-c", "/clabernetes/manager launch; sleep infinity"], volumes=["/lib/modules:/lib/modules"], publish=[50080])
After a few seconds, you should see the Deployment running:
>>> exp.list_resources()
NAME                            UID                                   AGE    STATUS
------------------------------  ------------------------------------  -----  --------
Deployment/test-clab            a3a45608-6e7e-4cc9-a6c4-e24d4089490f  5s     1/1
Service/srv-test-clab-nodeport  3856deed-22de-4b23-a300-bd4b35c2f27a  5s     --
>>> exp.list_pod()
KIND/NAME                       STATUS    AGE    NODE         IP
------------------------------  --------  -----  -----------  ------------
Pod/test-clab-686d9667ff-99hch  Running   18s    k8s-testing  10.97.108.65
We need to upload the lab files to Kubernetes:
clab.upload_files("misc/containerlab/lab2")
Here is an example of the expected output so far:
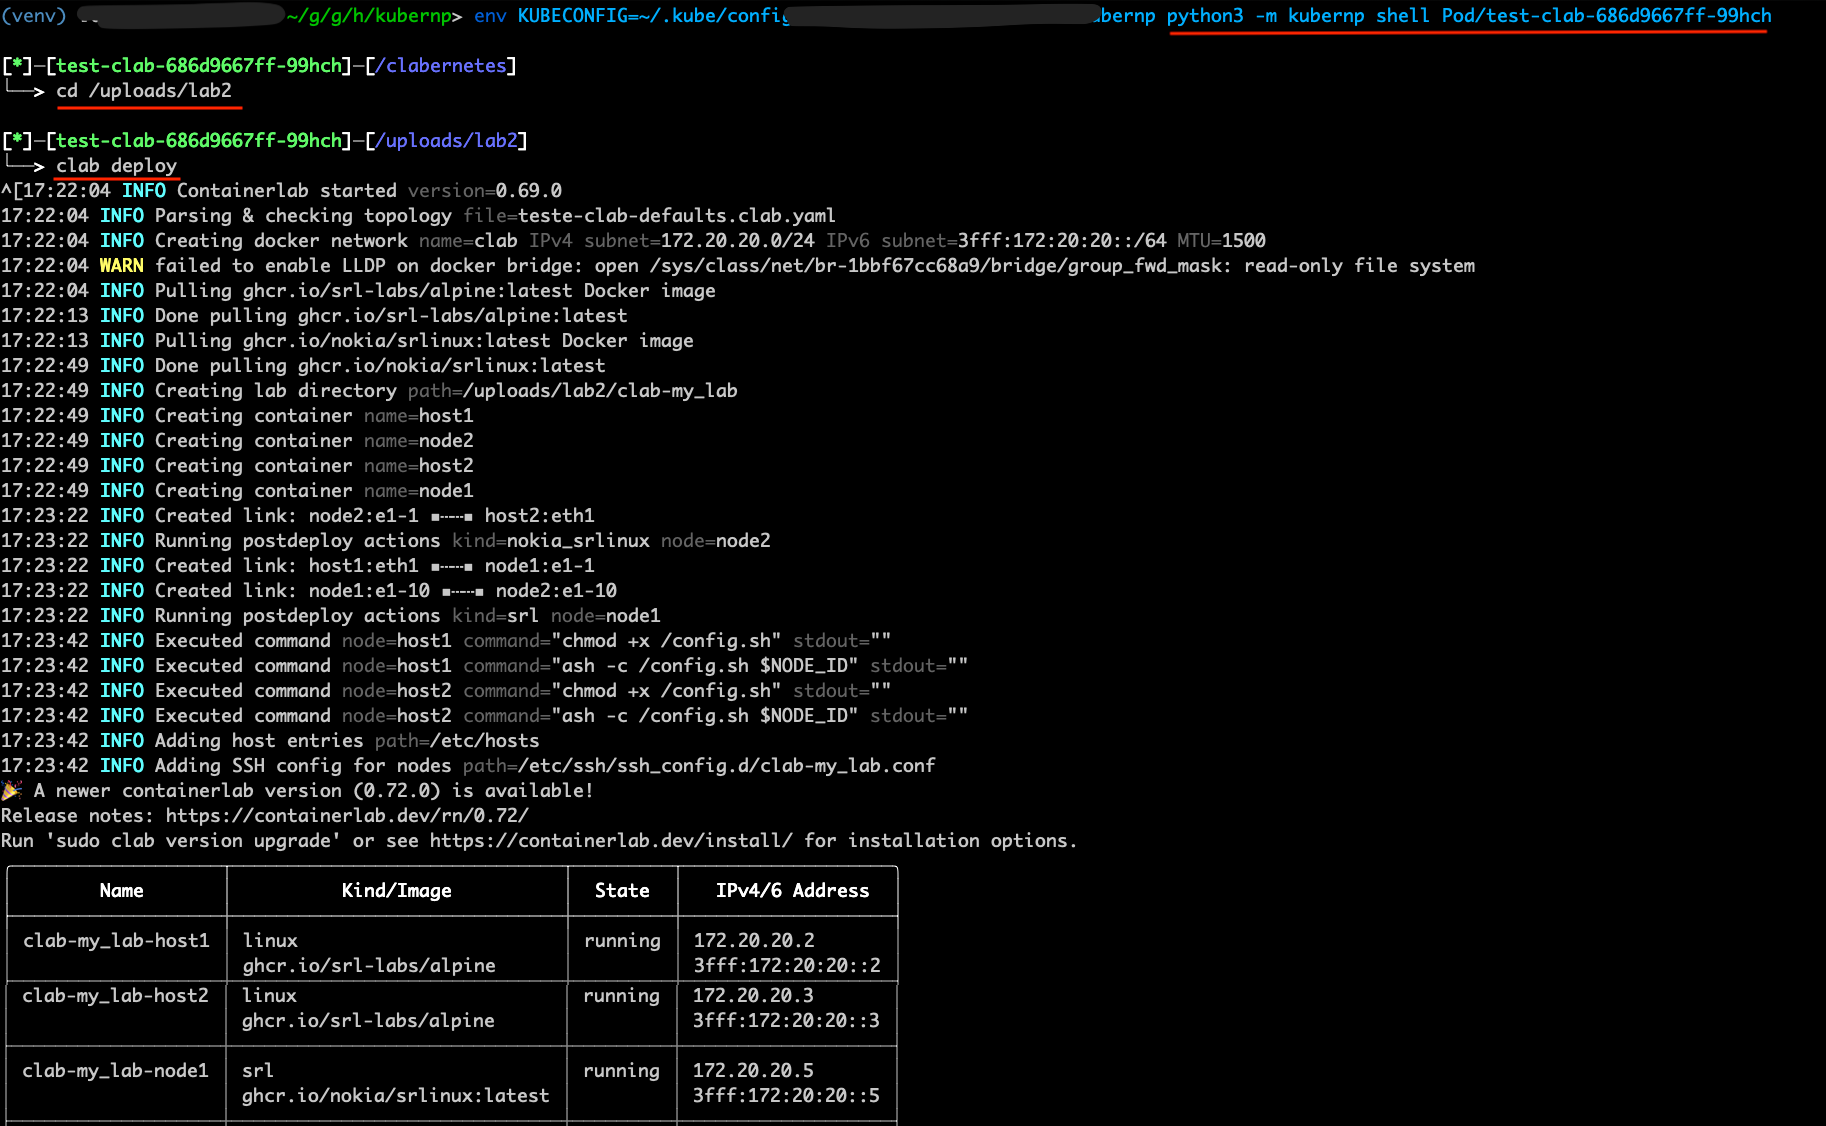
Now we will open a remote shell to the Pod and start our ContainerLab lab. For that, open a new terminal window/tab and run the following command (Notice: please use the Pod name as displayed on the list_pod output before):
python3 -m kubernp shell Pod/test-clab-686d9667ff-99hch
You should now get connected to the Pod shell. From there, you can navigate to the lab folder and start the lab:
cd /uploads/lab2
clab deploy
If all goes well, you should see the following output:
Then you can start the topology visualizer:
clab graph
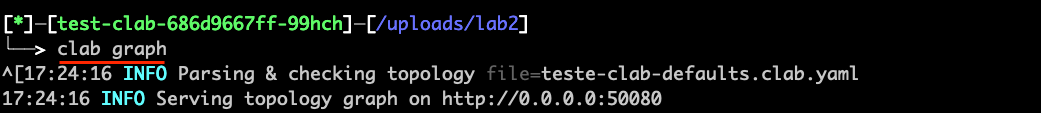
Go back to your Python console and get the corresponding endpoint to open the URL in the browser:
>>> exp.list_endpoints()
NAME ENDPOINT
--------- ---------------------
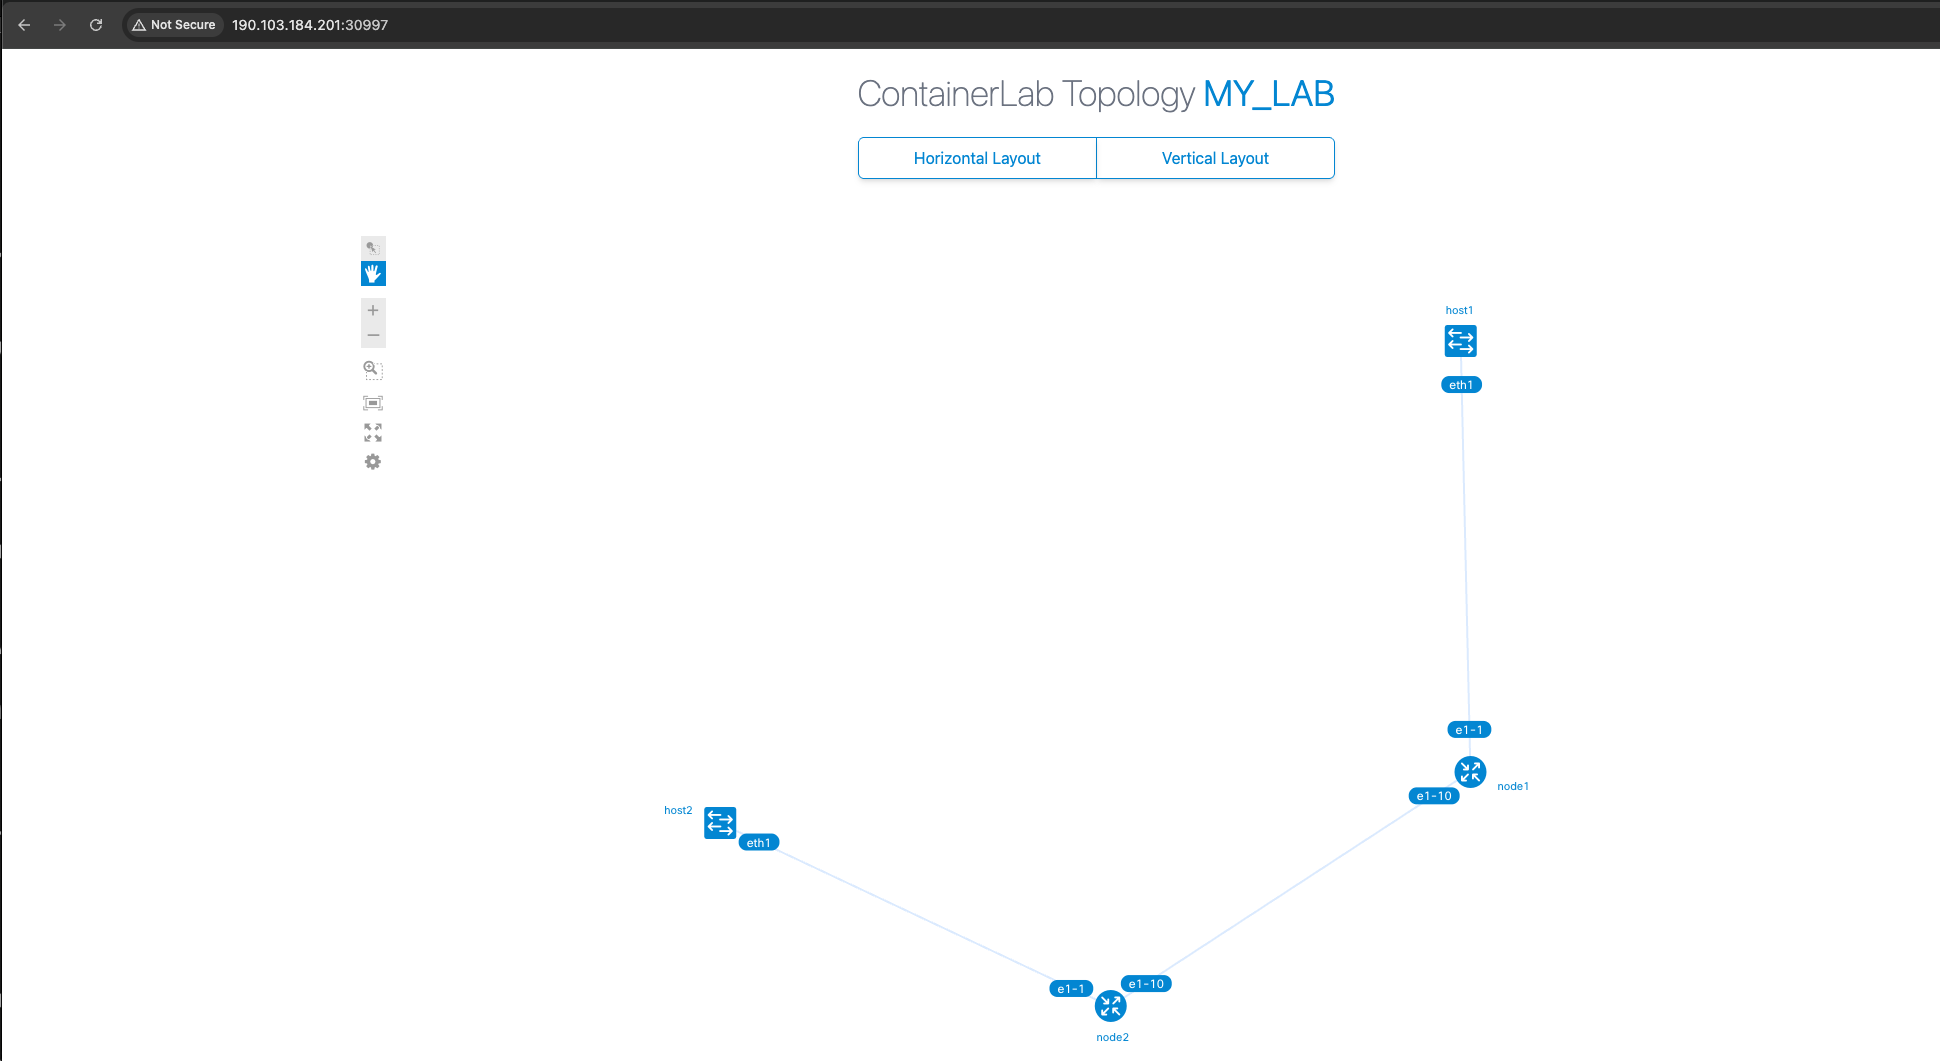
50080-tcp 190.103.184.201:30997
And open your Internet browser with that URL:
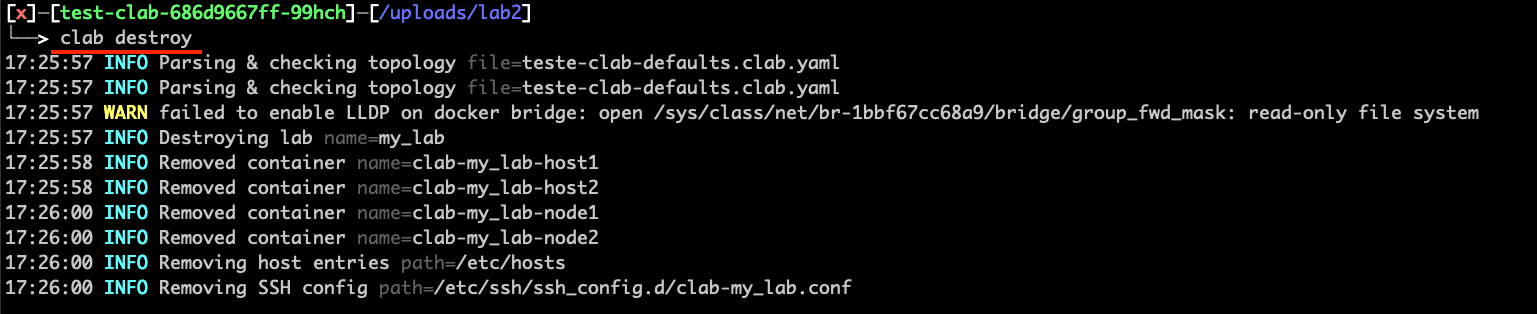
After playing with your lab, you can finish it by first destroying the lab on the Pod shell (if your shell is still running the topology visualizer, you can press CTRL+C):
clab destroy
Back to the Python console, you can finish the experiment to release all resources from the Kubernetes cluster:
>>> exp.finish()