After a hurricane causes destruction in a region in the United States, federal government organizations, such as the Federal Emergency Management Agency (FEMA), are deployed to provide need-based financial aid to the victims. In order to identify need in a timely matter, these organizations must be able to identify the amount of destruction for each affected area, the population density of the area, and the number of people affected in that population. Once identified, victims of hurricane disasters can be further categorized by extent of financial damage using an ordinal measurement system such as: Not Affected, Lightly Affected, Moderately Affected, and Severely Affected.
The objective of our project was to use aerial images of areas affected by hurricanes to determine the locations and extent of damage. This project was broken down into the phases below.
-
Phase 1 - Create a computer vision model that identifies damaged structures (based on light, moderate, severe damage) in post-storm aerial imagery. Stitch the imagery together using geocoordinates to produce a "damage report" based on location details (ex. zip code, street). [COMPLETED]
-
Phase 2 - Create a way for a user to interact with this model. [COMPLETED]
-
Phase 3 - Merge the "damage report" to information about general population density in these areas. [NEXT STEPS]
-
Phase 4 - Merge the "damage report" to information about property values in these areas to predict total cost of damage. [NEXT STEPS]

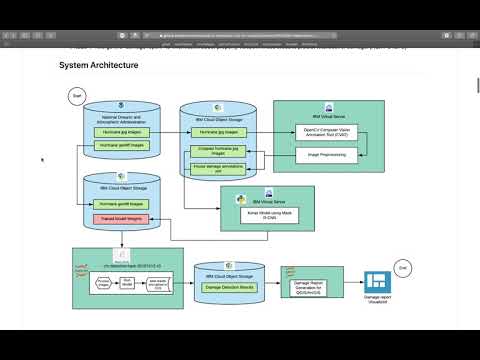
Data used to train this model comes from the National Oceanic and Atmospheric Administration. We used images taken via single engine aircrafts of disaster areas following two hurricanes: Hurricane Dorian in August 2019 and Hurricane Michael in October 2018. Below are links to the original datasets:
Hurricane Dorian: https://storms.ngs.noaa.gov/storms/dorian/index.html
Hurricane Michael: https://storms.ngs.noaa.gov/storms/michael/index.html
The original data was stored in IBM Cloud Object Storage to be generally accessible to our team members. Here are the commands written for Ubuntu Linux command line to interact with IBM Cloud Object Storage.
-
Download original zipped folder
curl –O https://stormscdn.ngs.noaa.gov/downloads/20181011a_jpgs.tar -
Create new directory to store unzipped files
mkdir 20181011a_jpgs -
Unzip tar file
tar -C 20181011a_jpgs -xvf 20181011a_jpgs.tar -
Iterate through each file and upload to IBM Cloud Object Storage
 for FILE in 20181011a_jpgs/*
     do ibmcloud cos put-object
 	    --bucket <cfc-image-storage-hurricane-michael>
 	    --key $FILE
 	    --body $FILE
 done;

 for FILE in 20181011a_jpgs/jpgs/*
 	do ibmcloud cos put-object
 		--bucket cfc-image-storage-hurricane-michael
 		--key $FILE
 		--body $FILE
 done;
Here is a step-by-step tutorial for accessing IBM Cloud object storage buckets via API key using pseudo-keys.
crn: <945f0b4t-3837-4y92-6jb7-4f5h83sd9826>
region: <us-east>
access_key_id: <08fbcce4727fd6400913dcc42016afc3>
secret_access_key: <e82ecd203fcb303653d3af8d073bd4864a385ec4cd786d22>
- Type
ibmcloud cos config authand choose2. HMAC - Type
ibmcloud cos config hmacand add the keys above - Type
ibmcloud cos config regionand add the region above - Type
ibmcloud cos config crnand add the CRN above - Type
ibmcloud cos config listand verify all inputs are correct - Type
ibmcloud cos list-bucketsto verify you have access to the buckets
In order to generate our model, it was necessary to annotate a representative sample of images. We used the open-sourced technology OpenCV Computer Vision Annotation Tool (CVAT) to annotate full-sized images. The following categories were used to label objects in the images:
1. no-damage-small-structure
2. lightly-damaged-small-structure
3. moderately-damaged-small-structure
4. heavily-damaged-small-structure
5. no-damage-medium-building
6. lightly-damaged-medium-building
7. moderately-damaged-medium-building
8. heavily-damaged-medium-building
9. no-damage-large-building
10. lightly-damaged-large-building
11. moderately-damaged-large-building
12. heavily-damaged-large-building
13. residential-building
1. small-structures
	- A structure no one would live in
	- Sheds
	- Stand-alone garages
	- Pool houses

2. medium-buildings
	- House of any size
	- Larger houses with attached garages
	- Gas stations
	- Small churches
	- Small duplexes

3. large-buildings
	- Attached townhouses
	- Large churches
	- Office buildings
	- Strip malls
	- Apartment complexes
	- Walmart
	- Grocery stores

4. no-damage
	- Little/no debris around the house
	- No roof damage

5. lightly-damaged
	- Tree fell on it but almost no roof damage
	- Little/no debris around the house
	- Broken fence debris against house

6. moderately-damaged
	- Some roof damage, but not a lot
	- Some missing shingles on roof, but major sections look intact
	- Debris around the house
	- Lots of trees fallen on house, even though no visible signs of roof damage

7. heavily-damaged
	- Parts of roof is missing
	- You can see wood studs in some parts
	- Lots of debris around the house
We used CVAT as an annotation tool to manually annotate images. CVAT was set up on an IBM Cloud Virtual Machine using IBM Cloud Object Storage. Image annotations were saved as xml files. See for a sample of annotated images: Sample Images and Sample Annotations
2.2.1 CVAT allows user to create annotation tasks, assign to other users, and track progress.

2.2.2 User specifies class labels and attributes.

2.2.3 Here is an example of the labeling for an image.

We created a function to crop annotated images into smaller tiles to be used for model training. See this file for information on running the function: crop_images.py
The annotated images are stored in Kaggle as public datasets. See the following links:
Mask Region-based Convolutional Neural Network (Mask R-CNN) model is amongst the state-of-the-art methods for object recognition tasks. The Matterport Mask R-CNN library allows you develop and train Mask R-CNN Keras Models for your own object detection tasks. This library is so far one of the best third party implementations of the Mask R-CNN models introduced in the 2018 paper titled "Mask R-CNN", which supports both object detection and object segmentation tasks. The Matterport library is open source released under a permissive license (MIT License) and has been widely used on a variety of projects and Kaggle competitions. To re-run the training experiments developed in this project, do the following:
Install all required packages using the requirements file. If you have any trouble with the mask r-cnn library installation, then see the installation instructions in the library's readme file.
-
The model train script relies on the following folder structure:
train_data └───Images (containing annotated images in .jpg) └───Annotations (containing image annotations from section 2 in .xml) -
Download the pre-fit Mask R-CNN model weights into your current working directory. It should have the name 'mask_rcnn_coco.h5'.
Obtain either the KerasModel.py script or the KerasModelColab.ipynb notebook in this repo.
-
About 80% of the data was used as the train set (which was about 1306 annotated images), whilst 20% was used as the test set (about 328).
-
The training phase takes a very long time to run on a CPU, so we suggest using a GPU instead.
-
There is an option of obtaining just this detect.py for detecting and predicting damages in new images. However, a pre-trained model weights file and a directory path to save the predictions are required as input parameters.
-
If the dataset was loaded properly and all bounding boxes and masks correctly obtained, you should see a displayed image like the one below, with bounding box and mask loaded as well.

-
When the training is complete, a new model weights 'model.h5', 'model_sumary.pkl', and text files will be created in the current working directory.
-
The evaluation and validation functions will be called using this new weights file in inference mode, and the mean Average Precision (mAP) scores will be calculated and displayed using both train and test datasets. Here are results we obtained for the mAP when we trained the model using different corresponding epochs:

The last set of results shown in the table above (i.e. 10new) corresponds to re-training done using 10 epochs with the new weights obtained from the 20 epochs training.
-
After the evaluation and validation, the model is saved as a json file in your current working directory.
-
Finally a function (detect_damages) is called to detect and predict the damages in a new image with confidence scores. An example of this image is:


The final trained weights are stored in Kaggle as a public dataset. See the following link: Final Model Weights Trained with 20 Epochs
The model-run pipelines are written as jupyter notebooks and are executed as parallel jobs in Watson studio.
For each of the hurricane GeoTIFFs in COS:
- Extract the image centroid (lat,lon) and map the centroid to zipcodes
- Convert TIFF to JPEG
- Run damage detection model using the weights file saved in COS
- Save annotated image JPEG and results JSON to COS
- Generate CSV report which has coordinates, zipcodes and number of damaged structures for each coordinate pair and the damage details
The results are then displayed using ArcGIS or as CSV report

The CSV results are then loaded into and ArcGIS map to share it to public go to: https://arcg.is/O4GL40 to access the interactive map
Here are a couple of screenshots from the web map
 Map showing the damage detection model results. The size of the cirlces represent the count of damged structures in that location.
The table below the map shows more details about the type of damage.
Map showing the damage detection model results. The size of the cirlces represent the count of damged structures in that location.
The table below the map shows more details about the type of damage.
 Clicking on any of the circles opens up a window which shows further details of the damaged structures
-
Watson Studio - Exploring annotations and object detection modeling.
-
Roboflow.ai - Exploring roboflow.ai annotation tools and object detection with YOLOv3
-
Lamogha Chiazor, IBM, Research Software Engineer
-
Tetiana Korchak, IBM, Test Automation Engineer
-
Krish Rekapalli, IBM, Data Scientist
-
Jon Wesneski, IBM, Test Automation Engineer
-
Keri Wheatley, IBM, Data Scientist