TokenGen is an interactive visualization tool for exploring how transformer-based language models predict tokens layer-by-layer. It provides insights into the evolution of token probabilities and attention head dynamics across transformer blocks. Built with Streamlit and Plotly. Website: TokenGen. Video:
- Token Probability Timeline: Track how token predictions evolve through each transformer layer.
- Attention Heatmaps: Visualize aggregated attention patterns across layers and tokens.
- Head Clustering: Discover patterns in attention heads using UMAP dimensionality reduction and K-means clustering.
- Model Comparison: Compare predictions and attention patterns between two models.
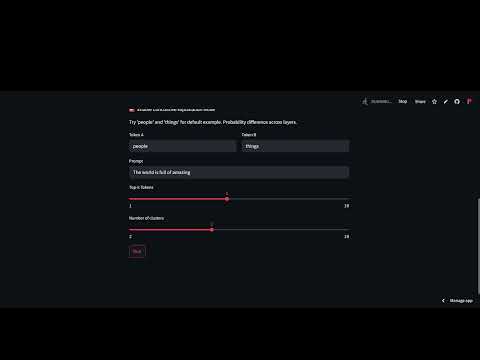
- Contrastive Analysis: Analyze model preferences between two tokens across layers.
- Clone repository:
git clone https://github.com/mitadake/tokengen.git cd tokengen - Install dependencies:
pip install -r requirements.txt
- Launch Streamlit app:
streamlit run token_prob_timeline.py
- In the browser:
- Select a model (or compare two)
- Enter your text prompt
- Adjust visualization parameters
- Explore different tabs and visualizations
-
Token Prediction:

Predicts the token based on the model chosen. -
Probability Timeline:

Shows how different token probabilities change through successive transformer layers. -
Attention Heatmap:

Displays layer-wise attention patterns aggregated across all attention heads. -
Head Clustering:

Groups of similar attention heads using K-Means to reveal functional patterns.


- GPT-2 (base, medium)
- DistilGPT-2
- OPT-1.3b
Note: Larger models require more memory and GPU resources. But a similar visualization can be done for them.
Try the default prompt: "The world is full of amazing"
- Observe probability shifts:
- See how "things" overtakes "people" in later layers for GPT-2 medium model.
- Notice how grammatical tokens remain strong throughout.
- Analyze attention patterns:
- See how early layers focus on determiners ("The").
- Notice later layers attending to descriptive words ("amazing").
- Compare models:
- Try GPT-2 vs. OPT-1.3b.
- Observe different attention allocation strategies.
Compare how two tokens fare across layers:
- Enable "Contrastive Explanation Mode".
- Enter tokens (e.g., "people" vs "things").
- See which layers prefer each token.

- First run will download selected models.
- Loading the model may take time.
- Clear the cache after analysis of the two/ three models.
- Work to be done: optimize the inference time and model loading using open-source tools like unsloth and onnx.
- Future work: Visualization support for custom models uploaded or from Hugging Face by the user.
Contributions welcome! Please open an issue first to discuss proposed changes.
MIT License
- Built with Hugging Face Transformers
- Visualization by Plotly
- Dimensionality reduction with UMAP
- Inspired by Transformer Explainer