
The AI-era entry point for social science research.
From policy evaluation, scale development, and complex surveys to spatial analysis, network analysis, and qualitative coding, socialverse tries to organize the methods most often used in social science research, and most easily misused by AI agents, into one reproducible research workbench: data, research design, models, diagnostics, evidence chains, figures, and paper deliverables can all be recorded, invoked, and audited in a single object.
It is built for researchers in economics, political science, sociology, psychology, communication, demography, public health, digital humanities, and related fields. You do not need a computer science background to understand what it is doing for you. If you use an AI agent, socialverse also gives the model a clear, queryable, executable analysis interface instead of letting it "invent" commands from memory.
socialverse is method infrastructure for social science research in the AI era.
Our judgment is straightforward: frontier large language models are already useful enough to read literature, generate code, explain statistical results, assist qualitative coding, and reproduce papers. But when they are asked to do social science analysis directly, the real failure point is often not "can the model talk?", but which method should be used, whether the assumptions hold, whether the result can be reproduced, and whether the conclusion is supported by evidence. In other words, social science AI agents do not only need stronger models; they need a reliable, queryable, executable, composable, and auditable analysis foundation.
socialverse is that foundation. Researchers can use it directly to complete standardized workflows, and AI agents can call it reliably through explicit tool contracts and methodological constraints, rather than inventing commands from memory, improvising workflows, or producing conclusions that cannot be traced.
It is the social-science part of AI4S (AI for Science): AI4Social. Similar to the mature AI4Bio infrastructure omicverse, socialverse is not meant to be a single-purpose tool. Its goal is to provide reusable research objects, method names, execution interfaces, and audit trails for an entire community of disciplines.
| Your scenario | The old pain point | With socialverse |
|---|---|---|
| Policy evaluation, where you want to explain "whether a reform had a causal effect, and how large it was" | You assemble difference-in-differences in Stata, worry about parallel trends, ask around for the current "heterogeneity-robust" approach so the method does not look outdated, and keep code scattered across many files | State the treated group and policy timing, then run parallel-trends diagnostics -> classic DID -> modern counterfactual estimation in one chain, with event-study figures, paper-ready regression tables, and a trace for every step |
| Questionnaire / scale development, where you need reliability, validity, and dimensionality | You run factor analysis in SPSS, compute reliability somewhere else, and restart the whole process when the data changes | Exploratory/confirmatory factor analysis, reliability, SEM, and IRT live in one place, with consistent naming and results that can go directly into the measurement section |
| Large weighted surveys such as CHARLS / NHANES / CGSS | Forgetting weights is wrong, but using weights means remembering many survey-design commands | Declare the sampling design once (weights / strata / PSU), and later estimates automatically follow the design instead of being run as a simple random sample |
| Interviews / text, where you need thematic coding and source-traceable claims | Qualitative software and quantitative software are separate worlds, and mixed methods require constant exporting and importing | Thematic coding, quote tracing, and reflexive memos live in the same package as quantitative analysis, so mixed methods do not require switching tools |
Frontier large language models already have strong language understanding, code generation, and research-assistance abilities, and can participate in social-science text annotation, qualitative coding, data analysis, and paper reproduction tasks [1, 2]. But in social science analysis, reliability is often determined not by whether a model can give an answer, but by whether it can choose the right method for a specific research question, identify statistical and causal assumptions, call appropriate data and code tools, execute reproducible analysis, and limit conclusions to what the evidence can support.
Existing benchmarks show that this bottleneck is concrete:
- StatQA contains 11,623 statistical analysis samples; GPT-4o's best performance is 64.83%, with errors concentrated in statistical method applicability errors, meaning "knowing the method name, but not knowing when to use it" [3].
- REPRO-Bench contains 112 social-science paper reproducibility assessment tasks; the best agent accuracy is only 21.4% [4].
- CORE-Bench contains 90 papers and 270 tasks across computer science, social science, and medicine; the best agent reaches only 21% accuracy on the hardest tasks [5].
These results suggest that the key bottleneck for social-science AI4S is not simply whether a model is "smart", but whether the model can be constrained by a reliable method, data, execution, and verification mechanism.
Conversely, tool augmentation and execution environments have already been shown to substantially amplify agent performance:
- InfiAgent-DABench evaluates data-analysis agents in a real execution environment; the official ICML 2024 version contains 603 data-analysis questions and 124 CSV files [6].
- Data Interpreter improves accuracy on InfiAgent-DABench from 75.9% to 94.9% through task decomposition, code execution, and step-by-step verification [7].
This is consistent with earlier findings on tool use and reasoning-acting frameworks [8, 9]: in complex analysis tasks, reliable infrastructure + tool contracts + execution feedback + audit mechanisms can significantly amplify model capability.
socialverse is positioned as exactly this kind of social-science analysis foundation. It organizes data structures, statistical methods, qualitative workflows, causal-inference tools, reproducibility standards, and result-auditing mechanisms into a capability layer that AI agents can call and compose reliably. Researchers can use these standardized workflows directly; AI agents can complete analysis under explicit tool contracts and methodological constraints, rather than inventing commands from memory, stitching together ad hoc workflows, or producing plausible-looking but untraceable conclusions without verification.
In short: socialverse aims to become the AI-era entry point for social science researchers, from data to paper: methods are interpretable, results are reproducible, figures are directly usable, and conclusions can be traced.
pip install socialverseThe core depends only on numpy + pandas; heavier backends for individual methods (statsmodels, scipy, networkx, scikit-learn, matplotlib, and so on) are loaded on demand. If a backend is not installed, the corresponding method will tell you what to install instead of crashing the whole program.
Project status: socialverse is under active development. The APIs listed in this README represent the current design target and the gradually opened capability map; actual function availability should be checked against the current version documentation, tests, and release notes.
In a real study, you usually have many scattered pieces: raw data, research design, a sequence of results, robustness checks, and the figures that eventually go into the paper. The conventional approach is to pass these through scattered variables and intermediate files. Over time, this becomes messy; months later, it is hard to say which figure came from which data version or specification, and reproduction becomes difficult.
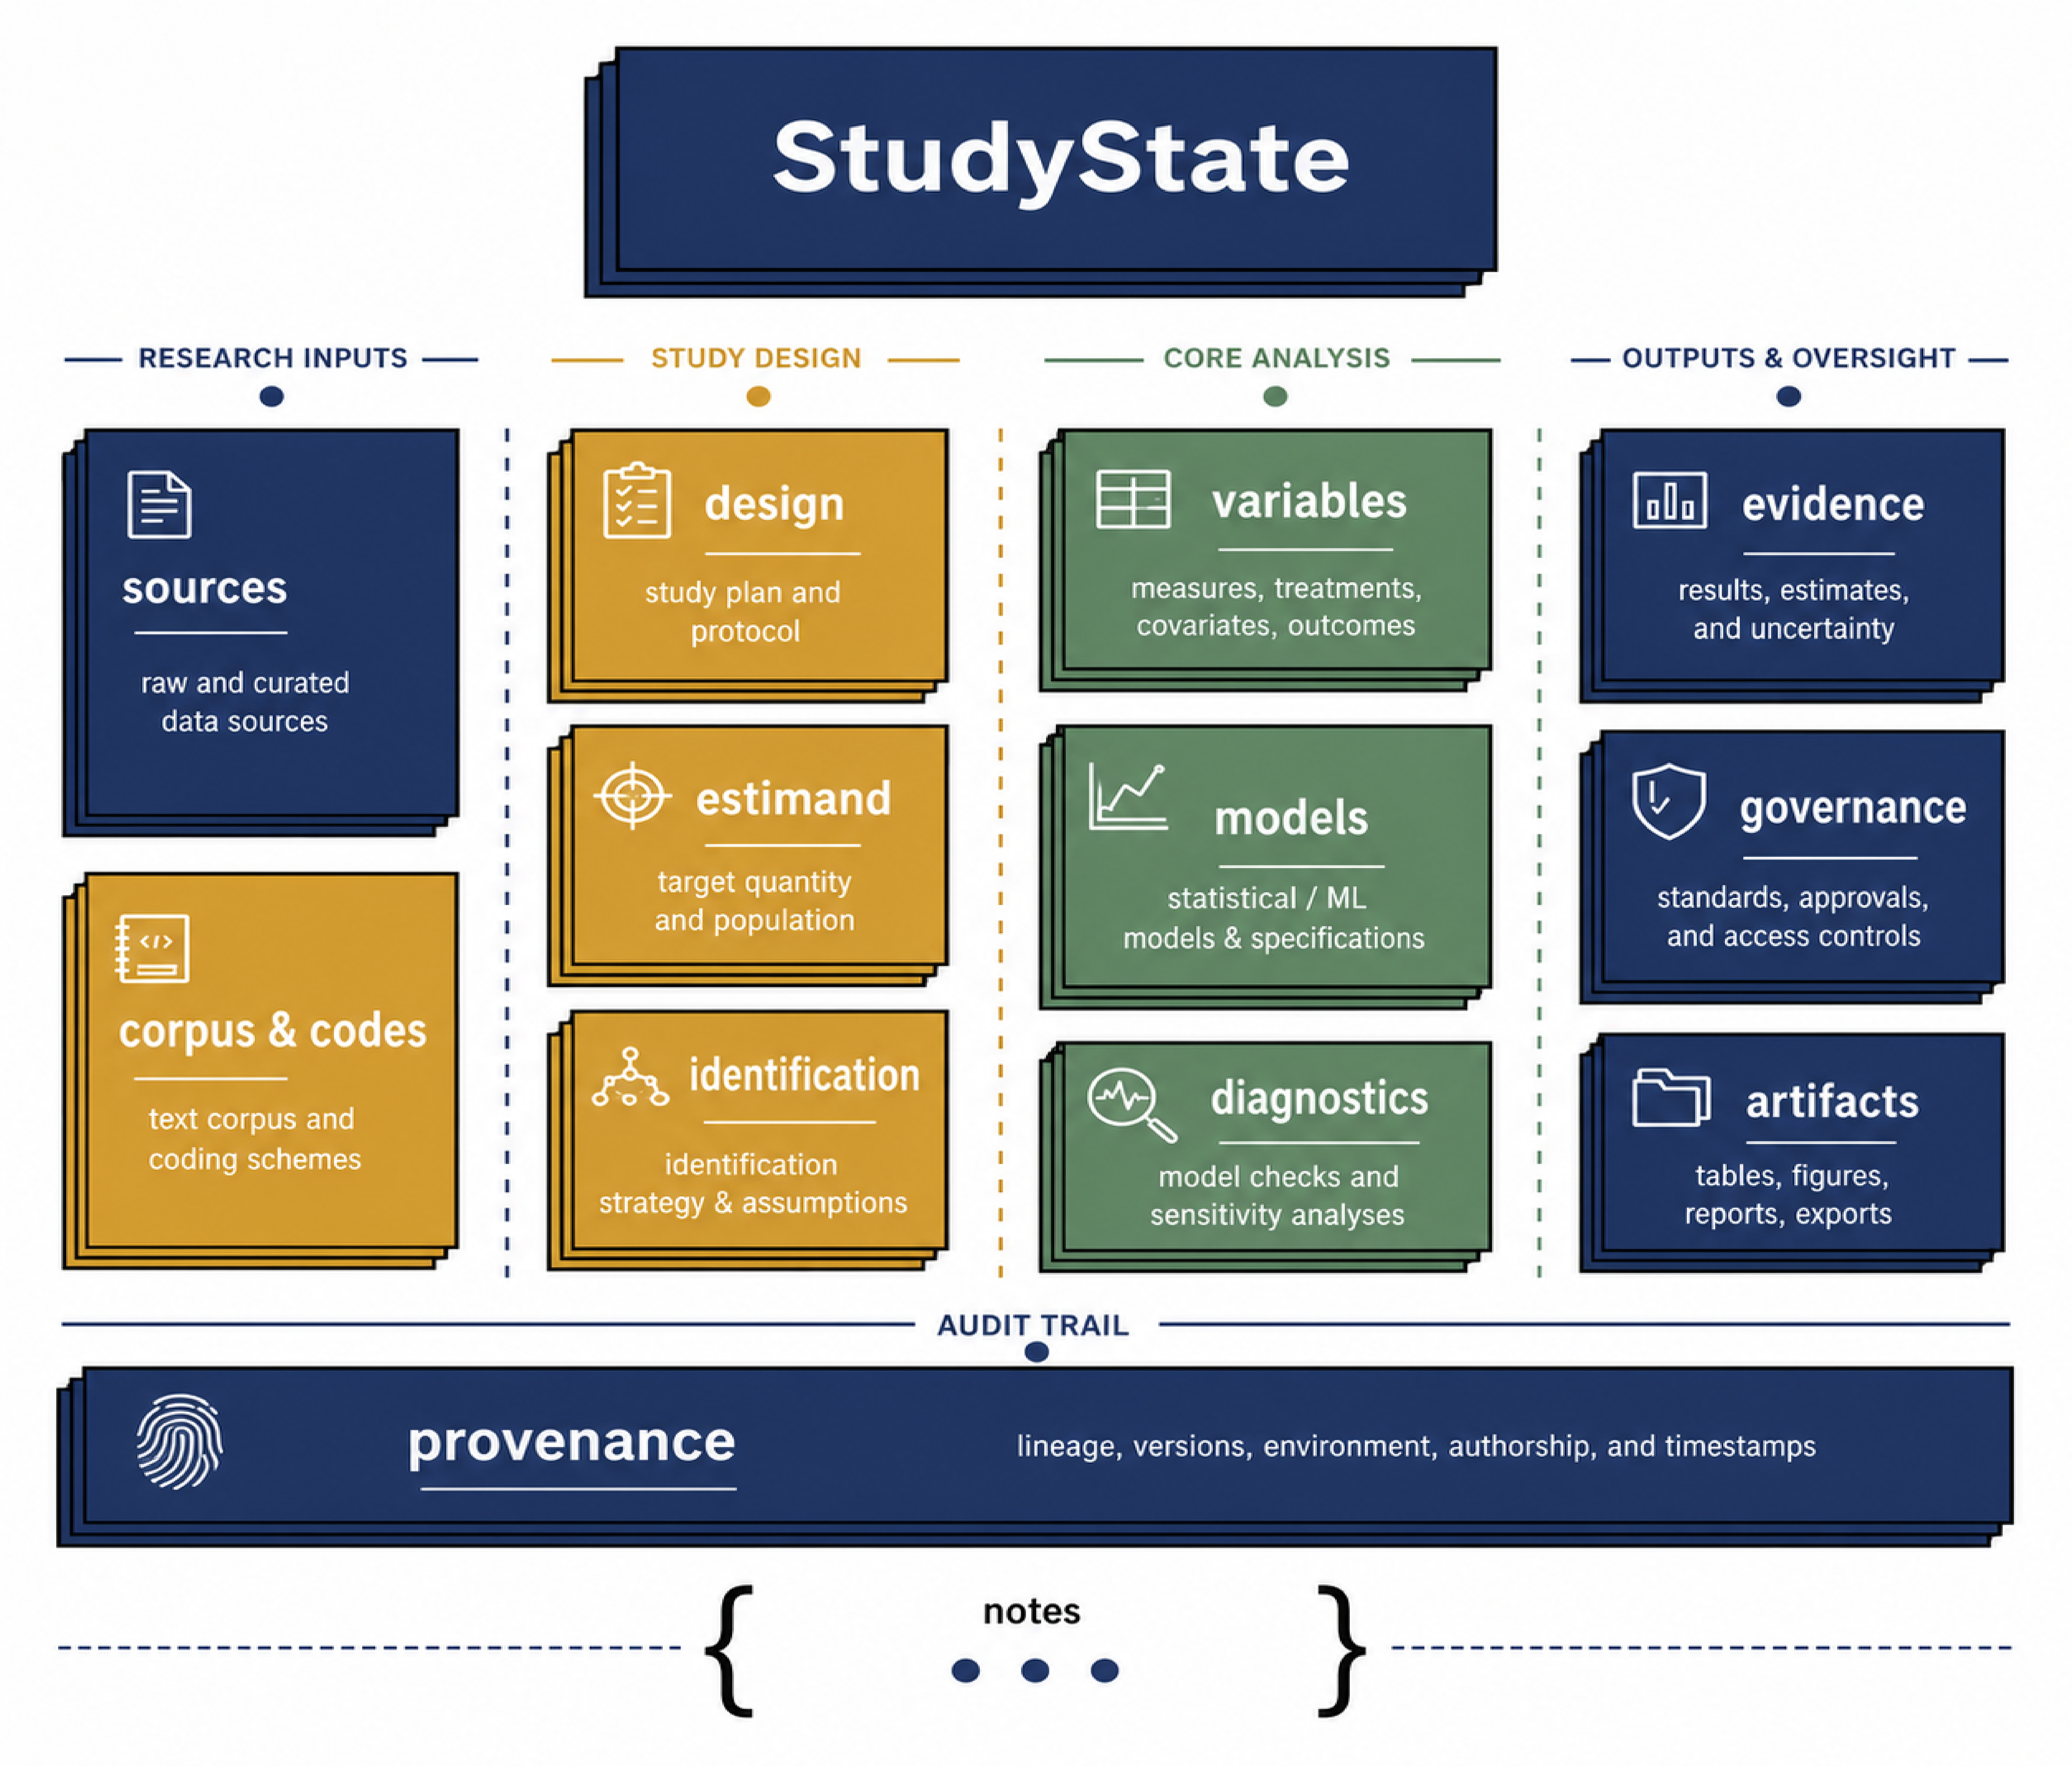
socialverse puts these pieces into one carefully designed object, StudyState. You can think of it as a project folder / research workbench: put the data in, every subsequent analysis step is archived automatically, and the final figures and tables are taken from the same object.
Its 12 compartments (slots) are not arbitrary. They correspond to the real life cycle of a social-science study: from the materials in hand, to the research design and variables, to what exactly is being estimated and under what identifying assumptions, then to results, diagnostics, evidence, and finally ethics, compliance, and deliverables. Each compartment also has conventional fields (for example, the "design" slot contains panel_id / time / treatment / weights / strata / psu). These fields are both hints and standards: a wrong slot name raises an error immediately, keeping a study well structured and easy to hand off from beginning to end.
The three analysis phases all operate on the same object. You do not need to manually pass data and results around: sv.pp writes into it, sv.tl reads and writes back, and sv.pl reads from it:
  sv.pp prepare ──writes──▶  sv.tl analyze ──reads+writes──▶  sv.pl plot/tables ──reads──▶  figures / tables

  StudyState's 12 slots = the life cycle of a study (after each colon are typical fields):

  ┌ Materials ───────────────────────────────────────────────────
  │  sources         raw inputs: datasets · corpora · bib · scans
  │  design          research design: panel_id · time · treatment · weights · strata · psu
  │  variables       variable table: outcome · exposure · controls · scales · constructs
  │  corpus · codes  text / qualitative coding: documents · dfm · tei · themes · segments   [qualitative]
  ├ Question ────────────────────────────────────────────────────
  │  estimand        estimand: target · population · effect
  │  identification  identifying assumptions: strategy · dag · parallel_trends · iv_validity
  ├ Results ─────────────────────────────────────────────────────
  │  models          fitted results: did · event_study · cox · topic · network
  │  diagnostics     diagnostics / robustness: pretrend · balance · robustness · reliability · sensitivity
  │  evidence        evidence chain: citations · verified_bib · quote_index · claim_evidence
  ├ Wrap-up ─────────────────────────────────────────────────────
  │  governance      ethics/compliance: ethics · data_use · pii_status · ai_disclosure
  │  artifacts       deliverables: figures · tables · docx · pdf · scripts
  └ Throughout ──────────────────────────────────────────────────
     provenance      ledger: every step records "which function · what params · what outputs", with a reproducible audit trail
The whole study's history is in one place, and every step is automatically written into the provenance ledger. Results are therefore naturally traceable and reproducible, which is exactly what you need when writing a paper, responding to review, or handing the project to someone else.
If you know bioinformatics:
StudyStateis to social-science analysis roughly what AnnData is to single-cell analysis. Both are the standard object that travels through the entire study. The difference is that social data (survey != corpus != network) cannot fit into one matrix, soStudyStateorganizes the components of a study, not a data matrix.
In daily use, you only interact with it in two ways. Everything else is automatically read and written by analysis functions, so you do not need to memorize the internal structure:
study = sv.StudyState()

study.write("variables", "outcome", "employment")   # 1. Tell it one fact: which variable is the outcome

study.models["did"]          # 2. Retrieve results: DID point estimate / SE / CI / robustness
study.diagnostics["bacon"]   #    Goodman-Bacon decomposition
study.artifacts["tables"]    #    Generated regression tables
The package is organized around three naming axes: sv.pp for preparation (ingest / declare design / build corpus / redact), sv.tl for analysis (causal / regression / measurement / multilevel / spatial / network / qualitative), and sv.pl for plotting and tables (forest plot / event-study plot / survival curve / publication-ready regression table).
Once you understand the study object, getting started means "write into it, let functions run, and retrieve the results". Here is a difference-in-differences (DiD) example: declare the panel design, test parallel trends, estimate the effect, and draw an event-study plot in a few lines:
import socialverse as sv
import pandas as pd

df = pd.read_csv("policy_panel.csv")          # your panel data (one row per unit x year)

study = sv.StudyState()                        # object that holds the whole study
study.write("variables", "outcome", "employment")
sv.pp.ingest(study, data=df)
sv.pp.declare_design(study, panel_id="state", time="year",
                     treatment="treated", first_treated="reform_year")

sv.tl.parallel_trends(study)                   # test parallel trends first
sv.tl.did(study)                               # DID ATT (cluster-robust SE + robustness)
sv.pl.event_study_plot(study)                  # event-study plot

print(study.models["did"]) # point estimate, confidence interval, and multiple SE choices| Method | In one sentence | Function |
|---|---|---|
| Difference-in-differences DiD / event study | Core workflow for panel policy evaluation, with clustered SE and robustness | sv.tl.did · sv.tl.event_study |
| Parallel-trends test | Pre-DID diagnostic | sv.tl.parallel_trends |
| Counterfactual imputation FEct/IFEct | Modern heterogeneity-robust DiD, correcting negative-weight bias under staggered adoption | sv.tl.fect |
| Sun-Abraham / two-step DiD / local projection | Interaction-weighted event study, Gardner two-step, LP impulse response | sv.tl.sun_abraham · sv.tl.did2s · sv.tl.local_projection |
| Goodman-Bacon decomposition | Diagnose "forbidden comparison" weights in TWFE-DiD | sv.tl.bacon_decompose |
| Synthetic control / synthetic DiD | Weighted controls fit counterfactual paths | sv.tl.synthetic_control · sv.tl.synth_did |
| Regression discontinuity RDD | Local-polynomial jump at the cutoff | sv.tl.rdd |
| Instrumental variables / 2SLS / shift-share | Two-stage least squares and Bartik shift-share instruments | sv.tl.iv_regress · sv.tl.bartik_iv |
| Propensity score matching | Nearest-neighbor matching + balance diagnostics | sv.tl.psm |
| Mediation analysis | Bootstrap decomposition of direct/indirect effects | sv.tl.mediation |
| Causal-graph identification + refutation | DAG -> backdoor/frontdoor/IV identification + placebo and other sensitivity refutations | sv.tl.dag_identify · sv.tl.dag_refute |
| Heterogeneous treatment effects (CATE) | Double machine learning, causal forests, S/T/X meta-learners | sv.tl.dml · sv.tl.causal_forest · sv.tl.metalearners |
| Quantile treatment effects | Effects at different quantiles of the outcome distribution | sv.tl.qte |
| Honest-DiD sensitivity | Robustness of conclusions to violations of parallel trends | sv.tl.honest_did |
| Method | Function |
|---|---|
| Linear / logit / probit / poisson (GLM, robust/clustered SE) | sv.tl.glm |
| Multinomial / ordered logit | sv.tl.mlogit · sv.tl.ologit |
| Marginal effects (AME) | sv.tl.margins |
| Method | Function |
|---|---|
| Confirmatory / exploratory factor analysis | sv.tl.cfa · sv.tl.efa |
| Structural equation modeling | sv.tl.sem |
| Item response theory (IRT) | sv.tl.irt |
| Reliability (Cronbach alpha / McDonald omega / ICC) | sv.tl.reliability |
| Inter-rater agreement (Cohen/Fleiss kappa, Krippendorff alpha) | sv.tl.interrater |
| Method | Function |
|---|---|
| Declare survey design (weights/strata/PSU) | sv.pp.declare_design · sv.tl.design_survey |
| Design-based weighted estimation | sv.tl.survey_estimate |
| Method | Function |
|---|---|
| Multilevel (mixed-effects) models | sv.tl.multilevel |
| Survival analysis (Cox / KM / time-varying covariates / log-rank / PH diagnostics) | sv.tl.survival |
Native (numpy/scipy) reimplementation of the metafor core — no R dependency.
The full multilevel prevalence/severity workflow (3-level rma.mv, heterogeneity
decomposition, meta-regression + FDR, publication bias, forest/funnel).
| Method | Function |
|---|---|
| Effect-size prep: proportion (logit/arcsine/FT), SMD/Hedges g, log-OR/RR/RD, Fisher z, generic CI | sv.pp.escalc · sv.pp.es_proportion · sv.pp.es_from_means · sv.pp.es_from_2x2 · sv.pp.es_from_r |
| Fixed / random-effects pooling (DL / REML / ML τ², Knapp-Hartung) | sv.tl.meta_fixed · sv.tl.meta_random |
Multilevel / 3-level meta with known sampling covariance V (rma.mv equivalent) |
sv.tl.vcalc · sv.tl.rma_mv |
| Heterogeneity (Q / I² / H² / τ) + 3-level I² decomposition + prediction interval | sv.tl.meta_heterogeneity · sv.tl.ma_i2_multilevel · sv.tl.meta_prediction_interval |
| Meta-regression on moderators + Benjamini-Hochberg FDR | sv.tl.metareg · sv.tl.metareg_fdr |
| More effect-size converters: from t/F/χ²/p, ratio-of-means, single-arm, incidence rate, Cohen's h, point-biserial | sv.pp.es_from_t · sv.pp.es_ratio_of_means · sv.pp.es_from_ir · sv.pp.cohens_h |
| Full τ² roster (DL/REML/ML/PM/SJ/HS/HE) + Q-profile τ²/I² CI + proportion back-transform + subgroup Q_between | sv.tl.meta_random · sv.tl.tau2_ci · sv.tl.backtransform_proportion · sv.tl.subgroup |
| Rare-event 2×2 pooling (Mantel-Haenszel, Peto) | sv.tl.meta_mh · sv.tl.meta_peto |
| Publication bias: trim-and-fill, PET/PEESE, Begg, fail-safe N, excess significance | sv.tl.trim_and_fill · sv.tl.pet_peese · sv.tl.begg_test · sv.tl.excess_significance |
| Robust variance for dependent effects (CR0/CR1/CR2), CHE & robumeta working models, permutation test | sv.tl.ma_robust · sv.tl.ma_che · sv.tl.robu · sv.tl.metareg_permutest |
| Influence / sensitivity: leave-one-out, cumulative, Cook's D / DFFITS, outlier refit | sv.tl.leave_one_out · sv.tl.cumulative_ma · sv.tl.influence |
| Small-study effects / funnel asymmetry (Egger) + contour funnel + Baujat | sv.tl.egger_test · sv.pl.funnel_contour · sv.pl.baujat |
| Forest plot (pooled diamond + prediction interval) · funnel plot | sv.pl.meta_forest · sv.pl.funnel |
| Systematic-review governance: PRISMA flow + 27-item checklist, RoB2/ROBINS-I/JBI, screening κ/AC1, GRADE | sv.gov.prisma_flow · sv.gov.risk_of_bias · sv.gov.screen_agreement · sv.gov.grade |
| Network meta-analysis (frequentist graph-theoretical, multi-arm; P-score/SUCRA, node-splitting, component NMA) | sv.pp.nma_pairwise · sv.tl.netmeta · sv.tl.netrank · sv.tl.netsplit · sv.tl.netcomb · sv.pl.netgraph |
| Diagnostic test accuracy (Reitsma bivariate → SROC) · dose-response (Greenland-Longnecker + RCS spline) | sv.tl.dta_bivariate · sv.pl.sroc · sv.tl.dosresmeta · sv.tl.dosresmeta_spline |
| IPD (two-stage / one-stage mixed) · semi-analytic Bayesian meta & meta-regression (no MCMC) | sv.tl.ipd_twostage · sv.tl.ipd_onestage · sv.tl.bayesmeta · sv.tl.bayes_metareg |
| Selection models (Vevea-Hedges), p-curve, p-uniform, selection sensitivity (S-value) | sv.tl.selection_model_stepfun · sv.tl.pcurve · sv.tl.puniform · sv.tl.pubbias_sensitivity |
| Advanced diagnostics: metaforest, LRT, profile-CI, cluster wild bootstrap, multimodel AICc, GOSH | sv.tl.metaforest · sv.tl.ma_lrt · sv.tl.ma_cwb_test · sv.tl.metareg_multimodel · sv.pl.gosh |
| Method | Function |
|---|---|
| Spatial autocorrelation (Moran) / spatial regression (SAR) | sv.tl.spatial_autocorr · sv.tl.spatial_regression |
| Network construction / ERGM / stochastic actor-oriented models | sv.tl.build_network · sv.tl.ergm · sv.tl.saom |
| Qualitative comparative analysis QCA (fsQCA) | sv.tl.qca |
| Method | Function |
|---|---|
| Life tables / demographic decomposition (Kitagawa) | sv.tl.life_table · sv.tl.decomposition |
| Oaxaca-Blinder decomposition (wage gaps/discrimination) | sv.tl.oaxaca |
| Method | Function |
|---|---|
| Thematic coding / quote tracing / reflexive memos | sv.tl.code_themes · sv.tl.trace_quotes · sv.tl.reflexive_memo |
| Theory lenses (Foucault / Bourdieu / Weber) | sv.tl.foucault_discourse · sv.tl.bourdieu_field · sv.tl.weber_ideal_type |
| Collation / TEI encoding / stylometry (Burrows Delta) | sv.tl.philology_collate · sv.tl.tei_encode · sv.tl.stylometry |
Forest plots, event-study plots, survival curves, RDD plots, Moran scatterplots, synthetic-control paths, dendrograms, and more live under sv.pl.*; it can also generate publication-ready regression tables (booktabs LaTeX / Markdown / plain text):
sv.pl.regtable(study, models=[("TWFE", study.models["did"]),
("FEct", study.models["fect"])], format="latex")- Governance: ethics checks, data-use compliance, AI-use disclosure -
sv.gov.ethics_check·sv.gov.data_use_check·sv.gov.ai_use_disclosure - Literature: free literature search, citation verification to prevent hallucinated references, reference management -
sv.lit.search_free·sv.lit.verify_citations·sv.lit.citation_manage
sv.datasets.* ships small, deterministic synthetic datasets with a documented ground truth (like sklearn's make_*), so every method has data to run on and a truth to recover. Beyond the method-specific toys (DiD, RDD, survival, IRT, QCA, spatial, networks, meta-analysis, …) there's a broad social-science / humanities set, each wired to its analysis function:
| loader | 类别 category | 目标函数 | 真值 recovered |
|---|---|---|---|
load_wages |
劳动经济学 / 分层 labor & stratification | oaxaca · glm |
gender wage gap ≈ −0.15 (unexplained) |
load_vote |
政治学 / 选举 political science | mlogit |
ideology slope ±1.1 by party |
load_values |
比较社会学 / 跨国 comparative | multilevel · cfa |
edu +0.40, country ICC ≈ 0.12 |
load_protest |
抗争政治 / 计数 contentious politics | glm (poisson) |
democracy +0.60, pop offset ≈ 1.0 |
load_coding |
传播学 / 内容分析 communication | interrater |
Fleiss κ ≈ 0.60 |
load_wellbeing |
心理学 / 面板 psychology panel | multilevel |
income +1.5, unemployment −1.2 |
load_complex_survey |
调查方法 survey methods | survey_estimate |
design-weighted 0.22 vs naive 0.33 |
load_speeches |
数字人文 / 语料 digital humanities | build_corpus |
labels learnable from vocabulary |
import socialverse as sv
df = sv.datasets.load_bcg() # + the metafor BCG classic (13 trials)You can find methods by the command names you already know. Each method carries a py-<command> alias (py- means Python reimplementation):
sv.tl.multilevel   # = R lme4::lmer / Stata mixed        (aliases py-lmer / py-mixed)
sv.tl.survival     # = Stata stcox / R survival::coxph    (aliases py-stcox / py-coxph)
sv.tl.cfa          # = R lavaan                           (alias py-lavaan)
sv.tl.rdd          # = rdrobust                           (alias py-rdrobust)
For the complete "Stata / SPSS / R command x socialverse method" crosswalk, see docs/README-full.md.
- Broad method coverage: one package covers the main quantitative + qualitative methods in social science, without switching among and stitching together a dozen libraries.
- Unified naming: three axes,
pp(prepare) /tl(analyze) /pl(plot), are consistent and easy to remember. - Reproducible results: every analysis step is recorded on the same research object; estimates and robustness checks are output together and can go directly into a paper.
- Honest degradation: use whichever backend is installed; when one is missing, provide methodological guidance instead of crashing.
- License: GPL-3.0-or-later
- Homepage: https://github.com/omicverse/socialverse · PyPI: https://pypi.org/project/socialverse/
- Method sources: each function's docstring marks the corresponding original academic literature. Please cite the original method papers in your own papers.
- Ziems, C., Held, W., Shaikh, O., Chen, J., Zhang, Z., & Yang, D. (2024). Can Large Language Models Transform Computational Social Science? Computational Linguistics, 50(1), 237-291.
- Abdurahman, S., Ziabari, A. S., Moore, A. K., Bartels, D. M., & Dehghani, M. (2025). A Primer for Evaluating Large Language Models in Social-Science Research. Advances in Methods and Practices in Psychological Science.
- Zhu, Y., et al. (2024). Are Large Language Models Good Statisticians? Advances in Neural Information Processing Systems 37, Datasets and Benchmarks Track. (StatQA)
- Hu, C., Zhang, L., Lim, Y., Wadhwani, A., Peters, A., & Kang, D. (2025). REPRO-Bench: Can Agentic AI Systems Assess the Reproducibility of Social Science Research? Findings of the Association for Computational Linguistics: ACL 2025.
- Siegel, Z. S., Kapoor, S., Nadgir, N., Stroebl, B., & Narayanan, A. (2025). CORE-Bench: Fostering the Credibility of Published Research Through a Computational Reproducibility Agent Benchmark. arXiv preprint / CORE-Bench project.
- Hu, X., Zhao, Z., Wei, S., Chai, Z., Ma, Q., Wang, G., Wang, X., Su, J., Xu, J., Zhu, M., Cheng, Y., Yuan, J., Li, J., Kuang, K., Yang, Y., Yang, H., & Wu, F. (2024). InfiAgent-DABench: Evaluating Agents on Data Analysis Tasks. Proceedings of the 41st International Conference on Machine Learning (ICML 2024).
- Hong, S., Lin, Y., Liu, B., et al. (2025). Data Interpreter: An LLM Agent for Data Science. Findings of the Association for Computational Linguistics: ACL 2025.
- Schick, T., Dwivedi-Yu, J., Dessi, R., Raileanu, R., Lomeli, M., Zettlemoyer, L., Cancedda, N., & Scialom, T. (2023). Toolformer: Language Models Can Teach Themselves to Use Tools. Advances in Neural Information Processing Systems 36.
- Yao, S., Zhao, J., Yu, D., Du, N., Shafran, I., Narasimhan, K., & Cao, Y. (2023). ReAct: Synergizing Reasoning and Acting in Language Models. International Conference on Learning Representations (ICLR 2023).