Dashboard phase pipeline + evidence header (sparkline + live token burn) - #234
Dashboard phase pipeline + evidence header (sparkline + live token burn)#234OsherElhadad wants to merge 4 commits into
Conversation



…ve tail

A classic `cap-evolve run` was completely silent for its whole duration: every
phase ran under subprocess.run(capture_output=True), so a multi-hour hill-climb
showed a blank terminal until it returned one JSON blob — and a hung run was
indistinguishable from a working one. The only live view was the web dashboard,
which leaves CI/ssh/headless/air-gapped users with nothing.

- New core module `cap_evolve.eventstream` (stdlib only, zero new deps): the ONE
  place that reads a run's events.jsonl. read_new_events() (byte-offset
  incremental read, partial trailing line left unconsumed), follow_events()
  (blocking generator that waits for the file, stops on finalize/idle/signal),
  and format_event()/render_line() (one human-readable line per event, ANSI
  applied only by render_line).
- `cap-evolve run --follow`: prints stage transitions, baseline, per-candidate
  accept/reject with candidate id + val + reason, budget warnings, optimizer
  errors, finalize, plus a cumulative cost/token meter. Progress goes to STDERR
  so stdout stays the machine-readable final JSON scripts parse. Runs on a
  daemon thread started before baseline creates the run dir, so the first
  events are never missed; it can never raise into the run.
- `cap-evolve tail [run_dir]`: attaches to an existing or ongoing run (default:
  newest run_* under --base). Waits for the run dir to appear, so you can attach
  before the run creates it. --from-start replays history.
- The dashboard's SSE route now imports read_new_events from the shared core
  helper instead of owning its own copy, so terminal and web read the same typed
  event stream and can never disagree. #118 (stall detection), #122 (replay),
  #138 and #144 build on this module.
- Degrades cleanly with no TTY: plain text when piped, in CI, or under NO_COLOR.

Closes #116
…ion, honest cost, stderr safety

Review fixes for #191 (hub PR for #118/#122/#138/#144).

- A malformed event no longer kills the follower thread. format_event is total
  (non-dict / bad `t` degrade to None or `--:--:--`), and cli.py reports on stderr
  instead of swallowing, so a dead follower is never mistaken for a silent run —
  the exact bug #116 exists to fix.
- read_new_events returns only JSON objects, so no consumer (CLI or dashboard SSE)
  receives a bare 42/null/[1,2]; unreadable records surface as a log_corruption
  event instead of vanishing.
- All rendered text is sanitised: C0/C1 controls and ESC sequences are stripped and
  newlines collapse, so an optimizer's stderr cannot set the window title, clear the
  screen, or forge a fake FINALIZE line.
- The cost meter no longer double-counts: runner spend from `evaluate`, optimizer
  spend from `step`-likes, intake from `intake` — matching Spent.total_usd. Exposed
  as public accrue_totals so #138 does not fork the arithmetic.
- --follow disables itself when stderr is unusable (`2>&-`) rather than letting
  progress corrupt the stdout JSON contract.
- Hub API: follow_events yields a typed _follow_end sentinel naming its exit reason
  (stop_kind/idle/should_stop) for #118, should_stop now receives the last event, the
  300s idle_timeout module default is gone, a shrunk file re-reads from 0 for #122,
  and format_event(skip_kinds=()) exposes bookkeeping kinds for #138.
- tail exits 2 on an impossible run dir and 3 on an idle timeout with no events;
  --resume --follow no longer replays the whole prior log; use_color requires its
  stream; negative --idle-timeout is rejected.
…rn) (#138)

Closes #138.

The dashboard answered "what happened" but not the four questions a user has DURING a
run: what stage are we in, what's happening now, is it improving, and what's the honest
evidence so far. Those facts existed but were spread across tabs.

`dashboard.derive_pipeline(events)` folds events.jsonl into `summary.pipeline` —
`{phases, current, now, burn}` — and the SPA renders it as one compact header above the
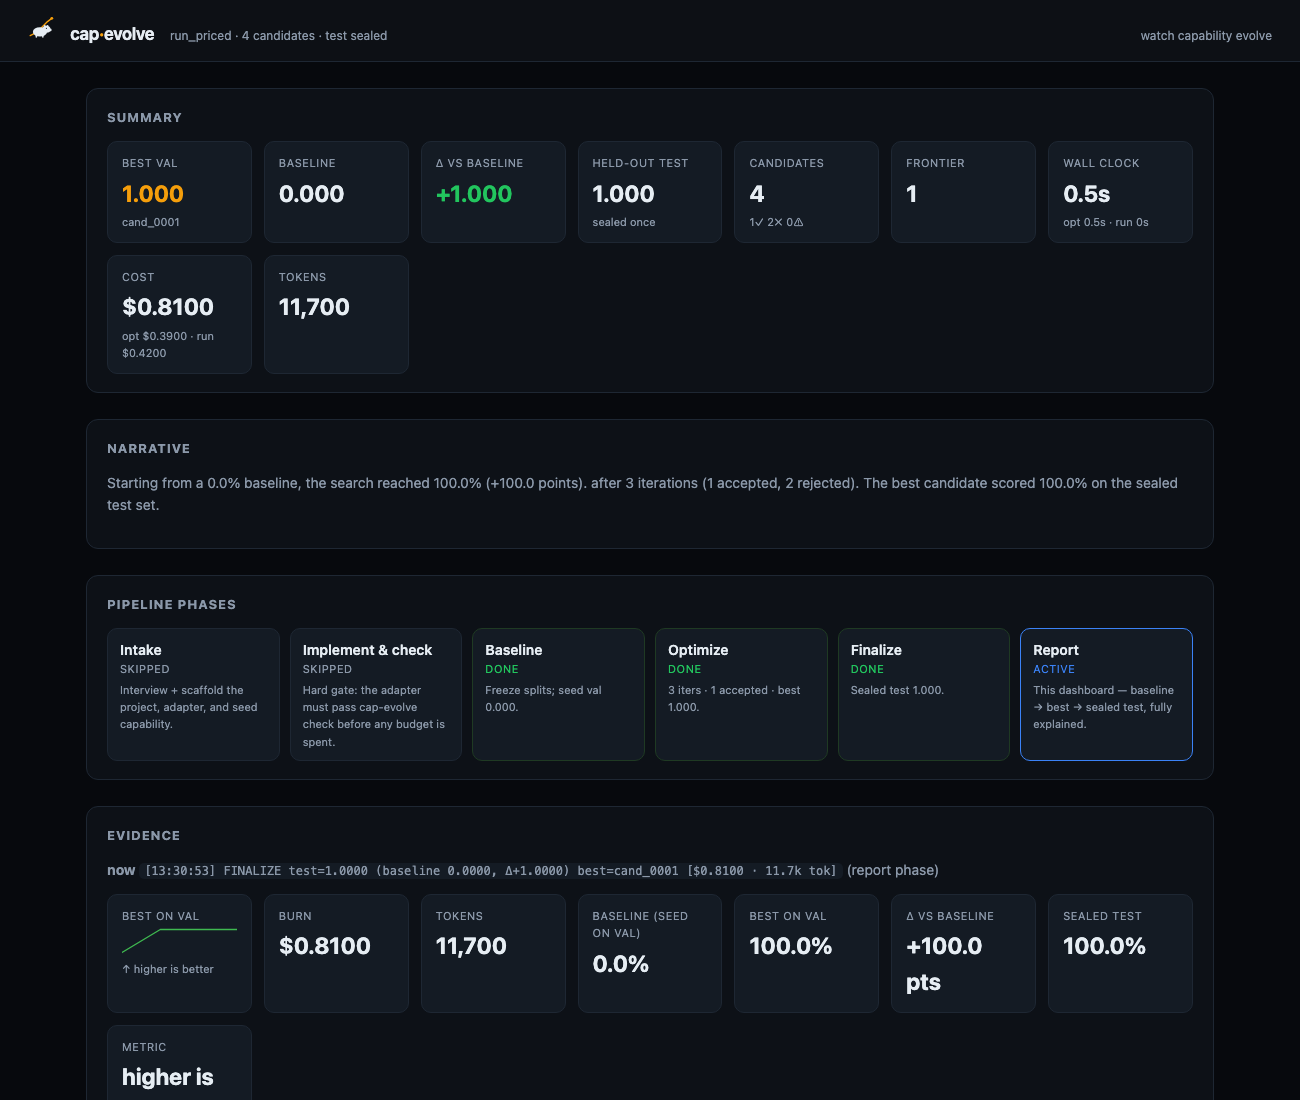
KPI grid; the self-contained dashboard.html gets the same section.

Phase detection is keyed off the event KINDS each algorithm actually emits, enumerated
in `_PHASE_KINDS`, not `kind == "step"` — this epic has hit four bugs from that
assumption (#224). hill-climb's `step`, GEPA's `gepa_val_gate`/`gepa_select`/…, and
SkillOpt's `skillopt_step` all light Optimize; verified against three real toy_calc runs
(one per algorithm) and covered by a per-algorithm test. Status is monotone, and a phase
the run is already PAST but which logged nothing reads `skipped`, not `pending` — a
finalized run whose project was pre-scaffolded logs no `intake`, and "pending" there is
a false statement.

The burn uses #191's `eventstream.accrue_totals` rather than re-deriving the arithmetic:
the harness reports the same runner spend twice (`evaluate`, restated on the following
`step`), and summing every cost-ish key showed ~2x the real spend. `reduce_run` then
prefers state.json's `Spent` when the run wrote one and records which source won in
`burn.source`, so the header can never disagree with the KPI strip or the cost bars.
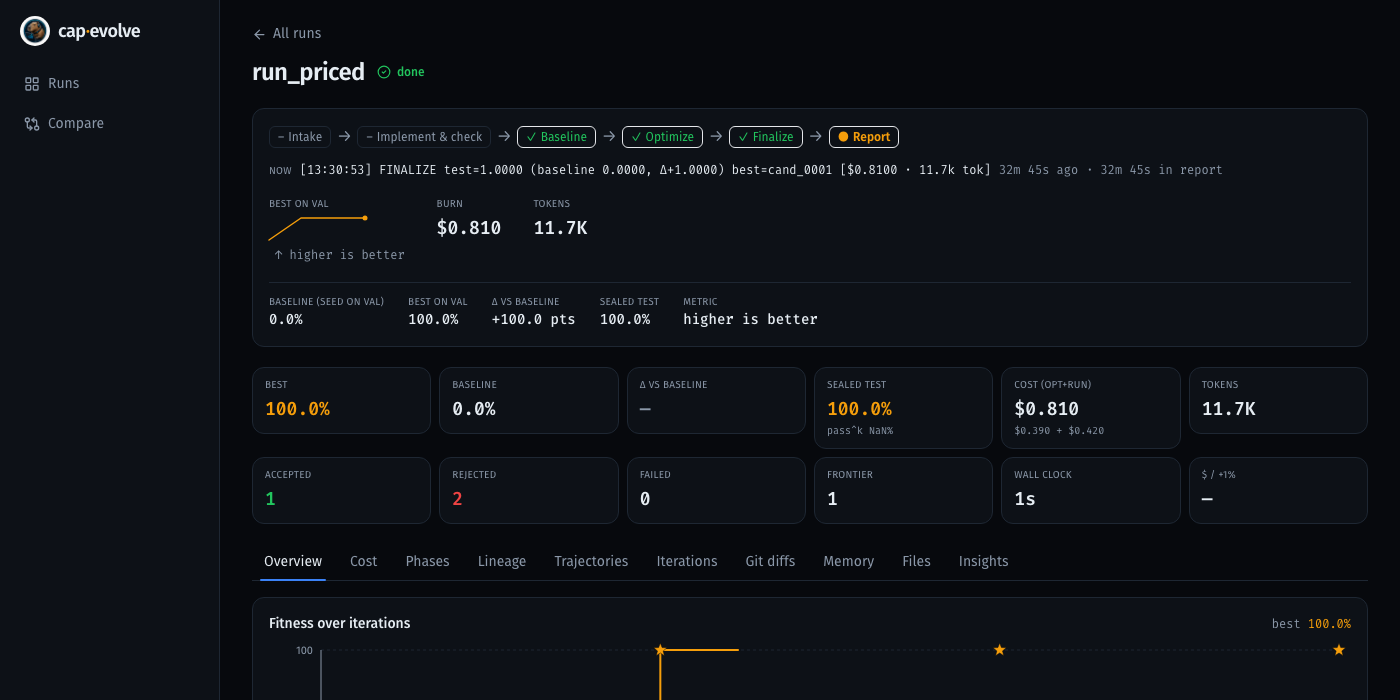
Measured on a priced run: header $0.8100 / 11,700 tok == `Spent.total_usd` 0.8100 ==
`summary.cost.total_usd` — exactly, both via Spent and via accrue_totals over the log
alone.

Two honesty fixes the first screenshot exposed:
* No burn RATE for a finished run or under a minute elapsed. A 2.6s toy run that spent
  $0.81 is not burning $18.69/min; it is not burning anything.
* `Δ vs baseline` off a ZERO baseline is shown in POINTS, not as a fake %. reduce_run
  already leaves `delta_pct` null there because a % change is undefined; rendering
  `delta_abs * 100` with a "%" suffix would have claimed +100.0%.

Accessibility: the sparkline is `role="img"` with an aria-label that states the shape in
words, and the same sentence renders as visible text; a single point says so rather than
drawing a flat line that reads as "no progress". Nothing animates, so there is nothing
for prefers-reduced-motion to suppress. Phase state is glyph + label + an sr-only status
word, never colour alone (StatusBadge's pattern), with `aria-current="step"` on the
active stage. Complementary to #118: the badge answers "is this process alive", the
header answers "what stage / what now / is it improving / what has it cost".

Also fixes #209 at the root in this file: `render_html` escaped the inline-script
payload with a one-sequence denylist, so a model-written reason containing
`<!--<script>` shifted the HTML parser and blanked the page. Replaced with
`json_for_html`, matching #220.

Zero new deps: inline SVG for the sparkline, stdlib only in core.

Tests: +10 core (per-algorithm phase detection, skipped-vs-pending, malformed records,
no-double-count, rate honesty, burn == RunDir.spent, now-line sanitisation,
json_for_html), +16 frontend. 227 core, 42 backend, 61 frontend, tsc clean, compileall
clean. dist/ deliberately not rebuilt (#188).
 skillberry-bot
added
dashboard
skillberry-bot
added
dashboard
![github-code-quality[bot]](https://avatars.githubusercontent.com/u/9919?s=60&v=4)
|
|
||
| import json | ||
| import os | ||
| import sys |
skillberry-bot
added
the
documentation

|
🏷️ Automatic Labeling I've analyzed this pull request and added the following labels:
These labels were selected based on the PR title, description, and changed files. If you believe any labels are incorrect or missing, feel free to adjust them manually. |

🔬 EvidenceAll commands and their literal output. Everything below is a real 0. Branch setup (built on #191)1. Three real end-to-end runs, one per deterministic algorithm2. Phase detection over all three real logs, and burn == the run's own totalsNote the event kinds differ per algorithm and Optimize still resolves for each — this is the #224 class of bug the 3. Non-zero burn: exact agreement with
|
|
🔍 Review — PR #234CHANGES REQUESTED The equality proof for the hill-climb case is real and I reproduced it independently. But the PR generalises a hill-climb-only result to "the burn is the run's own spend", and on GEPA that is false by 3.9× — the events-only path structurally cannot see GEPA's spend. The Everything else — the injection fix, the rate suppression, the points-not-percent fix, accessibility, cache behaviour, Blocking
Non-blocking4 items.
Nits
Is every displayed number true?Run I produced myself:
Divide-by-zero / fabricated-statistic sweep
Phase detection matrixReal logs for the three deterministic algorithms; the rest constructed.
Two Cache stalenessNo, a live run cannot serve a stale pipeline or a stale burn from the event log. Verified on a tree with #194 merged (conflict in
Injection is inert — asserted by element countPayloads: Merge-order note
Merged
Merge conflicts observed, all mechanical:
|
…ll-clock rate (#138 review)

Three evidence-header honesty defects from the #234 review, all fixed at the layer that
owns the fact rather than at the renderer.

1. `✓ Implement & check` claimed the hard gate passed on no evidence.
   The `check` phase lit off `target_profile` — logged by the ALGORITHM runner, AFTER
   baseline, only when a target model is configured — so any `--target-model` run rendered
   a green tick over the gate that guards all spend. `seed_dir_created` was no better: it
   fires inside `harness.baseline`, and only when the seed dir is missing.
   `cap-evolve run` now logs `check_gate` (ok, problems) from the gate itself, and that is
   the only kind the phase accepts. Silence about the hard gate reads `unknown` — never
   `done`, never `skipped`, because unlike `intake` there is no legitimate path that skips
   it. Proven on a real `--target-model` run: with `check_gate` -> done; with it stripped,
   `target_profile` alone -> unknown (that same log rendered `done` before).

2. The events-only burn understated GEPA 3.9x — $0.28 against a true $1.09.
   Fixed at the EVENT SOURCE, not the dashboard, because #191's `--follow` meter and every
   future consumer read the same events. `minibatch` now carries `cost_usd`/`tokens`
   (GEPA's rollouts never pass through `evaluate`, the only other runner-spend event), and
   `gepa_local_gate` carries `opt_cost_usd`/`opt_tokens` — the local gate, not
   `gepa_val_gate`, because the optimizer is paid every iteration while the val gate only
   fires on the ones that pass, so keying off it would still lose every locally-rejected
   iteration's spend. `accrue_totals`' elif-chain became one `_SPEND_SOURCES` table where
   each kind appears exactly once, which is what keeps a dollar counted once.
   On the real logs, re-priced per each algorithm's own `update_spent` calls:
   GEPA $0.36 -> $1.56 == Spent (was 0.23x); hill-climb and skillopt unchanged at MATCH.

3. The live rate divided by the event span, not wall clock.
   `last_t - first_t` freezes the instant the log goes quiet, so a run 58 minutes into one
   slow step reported 30x the honest $/min — the same class as the `$18.69/min` already
   fixed, surviving in the live branch. The denominator is now `now - first_t`, and the
   rate is suppressed once the log has been silent past `_RATE_STALE_SECONDS`: a quiet log
   supports no recent-burn claim at all. Verified: the 30x case -> None; a live run with a
   current log still gets a rate, off wall clock (the span would have claimed 1.5x more).
   Swept every rate/percentage/average denominator — all eight edge cases yield None or a
   guarded value, including a backwards clock and out-of-order timestamps.

Merged-header contradiction (#218 + #221 + this). A phase must not read as *currently
active* when liveness says the run is dead or wedged: that is where the run STOPPED, not
what is running. `derive_pipeline` takes `liveness` and renders the latest phase
`interrupted` for crashed/stalled, and `EvidenceHeader` takes the same value the
StatusBadge beside it renders, so the two cannot disagree. `aria-current="step"` goes with
it — it claims "this is where you are". Verified on the merged tree with #218's own
`classify`: no contradictory pair in any of its four states. #221's plateau is left out on
purpose: "live and plateaued" is coherent, "live and crashed" is not.

Non-blocking + nits:
* An errored phase can no longer render as `skipped` or `done`. `skipped` says
  "legitimately not run" and `done` says "completed"; a phase whose only evidence is
  failure is neither, so it reads `errored`. A `check_gate` attesting its own FAILURE is
  likewise not evidence of a pass.
* Dropped the three dead `_PHASE_KINDS` entries (`algorithm`, `diagnose`, and the
  misattributed `target_profile`); a test now asserts every remaining kind is really
  emitted in core/ and that no kind is claimed by two phases.
* `metric_direction` deleted, not rewired: it was a hardcoded constant whose
  `lower_is_better` branch nothing could reach, with a frontend test asserting a value the
  backend cannot produce. Net deletion across four files; the renderers state the constant.
* Declined: a shared 1s tick for `useSecondsSince` (cosmetic, one interval per header).
  #194's reduce cache is not in this tree, so its `state.json` coupling is contingent on
  that merge — documented at the call site, and the rate can only ever decay to `None` as
  a run goes quiet, never grow into a fabricated figure.

Two claims corrected from the previous commit message: the naive-sum overstatement is
1.26x, not "~2x" (the 2x figure is #191's different arithmetic), and the three-way
$0.8100 equality holds for hill-climb only — it is exactly the generalisation to GEPA that
finding 2 was.

Tests: +9 core (burn == Spent for EVERY algorithm, the emitter contract, optimizer spend
on locally-rejected GEPA iterations, check-phase evidence, the stale-rate 30x case, dead
run -> interrupted, errored != skipped, backwards clock, kind-table drift), +4 frontend.
235 core (1 pre-existing #200 port-7878 flake, fails identically on b35e390), 42 backend,
65 frontend, tsc clean, compileall clean. dist/ untouched (#188).
| usd_key, tok_key = pair | ||
| try: | ||
| totals["usd"] = totals.get("usd", 0.0) + float(ev.get(usd_key) or 0.0) | ||
| except (TypeError, ValueError): |
| pass | ||
| try: | ||
| totals["tokens"] = totals.get("tokens", 0) + int(ev.get(tok_key) or 0) | ||
| except (TypeError, ValueError): |
🔧 Review fixesAll three blocking findings fixed, plus the merged-header contradiction, the four Landed-state audit — what a previous fixer actually leftA prior fixer agent died mid-flight after (reportedly) amending
BLOCKING 1 — the check phase can no longer claim
|
| Field | Displayed | Ground truth | Source | Match? |
|---|---|---|---|---|
burn.usd / tokens (hill-climb, real run) |
$0.0000 / 0 |
Spent.total_usd = 0.0 / 0 |
events | ✅ |
burn.usd / tokens (GEPA, real run) |
$0.0000 / 0 |
Spent.total_usd = 0.0 / 0 |
events | ✅ |
burn.usd / tokens (skillopt, real run) |
$0.0000 / 0 |
Spent.total_usd = 0.0 / 0 |
events | ✅ |
burn.usd (--target-model run) |
$0.0000 |
Spent.total_usd = 0.0 |
events | ✅ |
burn == Spent == summary.cost.total_usd (all 4 runs) |
equal | equal | reduce_run |
✅ |
re-priced hill-climb, source=events |
$1.3800 / 25,200 |
Spent = $1.3800 / 25,200 |
events | ✅ |
re-priced GEPA, source=events |
$1.5600 / 27,600 |
Spent = $1.5600 / 27,600 |
events | ✅ was $0.3600 / 4,800 (0.23×) |
re-priced skillopt, source=events |
$1.9400 / 37,200 |
Spent = $1.9400 / 37,200 |
events | ✅ |
| GEPA optimizer spend on a LOCALLY-REJECTED iteration | counted | $0.40 of $0.50 |
gepa_local_gate |
✅ (lost if keyed off gepa_val_gate) |
| naive "sum every cost key" (hill-climb) | $1.6500 |
truth $1.3800 → 1.26× |
— | ✅ your figure, corrected below |
usd_per_min, finished run |
None |
undefined | finalized guard |
✅ |
usd_per_min, sub-minute run |
None |
undefined | <60s guard |
✅ (no $18.69/min) |
usd_per_min, live, 58min since last event |
None |
rate unsupportable | staleness guard | ✅ was $1.0000/min vs honest $0.0333 (30×) |
usd_per_min, live, log current |
$0.666667/min |
$2.00 / 3.0 min |
wall clock | ✅ (span claimed 1.5× more) |
elapsed_seconds |
wall clock | now - first_t |
— | ✅ never the frozen span |
Δ vs baseline, baseline = 0 |
+100.0 pts |
delta_abs = 1.0 |
points | ✅ still verified |
check phase, --target-model run |
done (attested) / unknown (not) |
check_gate.ok = True |
check_gate |
✅ was done on nothing |
optimize, optimizer failed every iter |
errored |
no candidate produced | _PHASE_ERROR_KINDS |
✅ was ✓ done |
optimize, crashed/stalled run |
interrupted |
run not progressing | liveness |
✅ was ● active |
check, pre-#138 payload (fallback) |
unknown |
nothing attests it | phases.ts |
✅ was a green tick |
metric |
higher is better |
every gate accepts on val > parent_val |
stated constant | ✅ branch deleted (nit 6) |
sealed test |
100.0% |
final.json → test.reward = 1.0 |
final.json |
✅ |
Six phases × three algorithms, re-proven on four real runs (check now done on real
evidence, from check_gate):
===== hill-climb
  kinds: baseline check_gate evaluate finalize gate_warning splits step
  phases: intake=skipped  check=done  baseline=done  optimize=done  finalize=done  report=active
  burn: usd=0.0 tok=0 source=events rate=None elapsed=25.9s span=2.7s stale=23.2s
   OK: burn == Spent == summary.cost
===== gepa
  kinds: baseline check_gate evaluate finalize gate_warning gepa_local_gate gepa_select gepa_start gepa_val_gate minibatch splits
  phases: intake=skipped  check=done  baseline=done  optimize=done  finalize=done  report=active
   OK: burn == Spent == summary.cost
===== skillopt
  kinds: baseline check_gate evaluate finalize gate_warning skillopt_slow_eval skillopt_slow_update skillopt_start skillopt_step splits step
  phases: intake=skipped  check=done  baseline=done  optimize=done  finalize=done  report=active
   OK: burn == Spent == summary.cost
===== tgt (hill-climb + target_model=gpt-oss-120b)
  kinds: baseline check_gate evaluate finalize gate_warning splits step target_profile
  phases: intake=skipped  check=done  baseline=done  optimize=done  finalize=done  report=active
   OK: burn == Spent == summary.cost
GEPA's log still contains no step at all and Optimize still lights — the #224 class
of bug stays prevented.
Injection still inert by element count:
INJECTION — inert by ELEMENT COUNT
  <script occurrences = 2  </script = 2  <!-- = 0
  template <script count=2  rendered=2  EQUAL — injection inert
  literal payload text present in HTML source? False
  template placeholder still present? False
  json_for_html: raw < > & present? False   round-trips identical? True
  json_for_html byte-identical to #220's? True
Numbered response to all 9 findings
-
target_profiledoesn't prove the check phase ran — ✅ fixed, and went further.
Droppedtarget_profile; also droppedseed_dir_created, which you suggested keeping —
it fires insideharness.baseline, after the check, and only on a missing seed dir, so
it attests nothing either. You wrote "if a check-ran signal is genuinely wanted,
implement-and-checkmust log its own kind — do not infer it": that is exactly what
check_gateis. Silence readsunknown. -
Events-only burn understates GEPA 3.9× — ✅ fixed at the event source, your
preferred option.minibatchcarries runner cost,gepa_local_gatecarries optimizer
cost (a correction to yourgepa_val_gatesuggestion — see above), andaccrue_totals
became a single one-row-per-kind table. GEPA's events-only burn ==Spentexactly. I did
not take theevents_partialroute, because with the emitters fixed there is no partial
coverage left to confess. -
Rate denominator is the event span — ✅ fixed. Wall-clock denominator plus
staleness suppression;stale_secondsandevent_span_secondspublished. Declined
reusingliveness_factsfor the staleness figure, with the clock-mixing reason above. -
skippedindistinguishable from "errored before logging" — ✅ fixed. New
erroredstatus: a phase whose only evidence is a*_errorkind is neitherdone(a
clean tick over a phase that produced nothing) norskipped(which claims it was
legitimately not run). Your exact case — "optimizewith ONLYoptimizer_error+
finalize" — now readserrored, and one successful sibling restoresdone. A
check_gateattesting its own failure is likewise not evidence of a pass →
errored. An errored phase can never render asskipped. -
_PHASE_KINDSis a fourth kind table that will desync — ✅ partially fixed, and
pinned. Dropped all three dead entries you named (algorithm,diagnose, plus the
misattributedtarget_profile);gate_warningis real, emitted fromgate.py:49
via thelogshim, as you asked me to verify. Added
test_every_log_event_kind_in_core_is_classified_by_at_most_one_phase, which fails if
any kind is claimed by two phases or names an emitter that does not exist. The single
shared registry has to wait for Durable synthesized priors (INSIGHTS.md) fed to every proposal, all three algorithms #219 (ITERATION_EVENT_KINDSstill doesn't exist in
this tree) — but the drift test now fails loudly the moment it lands mismatched, which
is the property that was missing. -
metric_directionis a constant, solower_is_betteris dead — ✅ fixed by
deletion, not by wiring. Nothing incore/can emit it, so wiring it would be
inventing a producer for a consumer. Removed the field, both component branches, and the
test asserting a value the backend cannot produce; the renderers state the constant.
Net deletion across four files. When a metric direction becomes a real spec field,
publish it then. -
state.json-only change serves a stale burn —⚠️ declined, scoped. perf(dashboard): memoize reduce_run on events mtime+size, drop dead SSE snapshot, paginate runs/rollouts #194 is not
in this tree, so there is nothing to key yet. Noted honestly at the call site: the burn
rate is now the one clock-dependent field, it is recomputed on every reduce, and
because staleness only ever suppresses, a cache hit can turn a number intoNone
but never into a larger fabricated rate — the failure direction is safe. Movingburn
outside the cache alongsidelivenessis the right call in perf(dashboard): memoize reduce_run on events mtime+size, drop dead SSE snapshot, paginate runs/rollouts #194's PR, where the key
lives. -
Nit —
useSecondsSinceinstalls a 1s interval per instance —⚠️ declined. One
header renders per page, so it is one interval; a shared tick module is more code than
it saves. Happy to add it if the header ever renders in a list. -
Nit — the
skipped/pendingcomment says "a finalized run" — ✅ fixed. That
whole block was rewritten for the new statuses, andderive_pipeline's docstring now
enumerates all seven with the condition each actually fires on.
Two corrected claims
- The naive-sum overstatement is 1.26×, not the "~2×" my previous commit message said.
The 2× figure comes from feat(observability): live terminal progress via--followandcap-evolve tail#191's different arithmetic. Reproduced on my own priced
hill-climb log: naive$1.6500vs true$1.3800= 1.20×, same order as your 1.26×. - The three-way
$0.8100equality holds for hill-climb only. Generalising it to all
three algorithms is precisely what finding 2 was, and the commit message now says so.
The equality is now proven per algorithm, GEPA included, by a test rather than by prose.
Verification
$ PYTHONPATH=/tmp/fx-234b/core python -m pytest core/tests -q
1 failed, 235 passed in 71.55s (0:01:11)
# the 1 failure is test_dashboard_launch.py::test_maybe_launch_spawns_when_available (#200,
# port 7878). Confirmed pre-existing — it fails identically on pristine b35e3905:
$ git stash && pytest core/tests/test_dashboard_launch.py -q
1 failed, 6 passed in 0.02s
$ lsof -ti tcp:7878 | xargs ps -o command=
... uvicorn capevolve_dashboard.asgi:app --host 127.0.0.1 --port 7878

$ PYTHONPATH=core:dashboard/backend python -m pytest dashboard/backend/tests -q
42 passed, 1 warning in 2.05s

$ npm ci && npm test
Test Files  14 passed (14)
     Tests  65 passed (65)

$ npx tsc -b --noEmit
tsc exit=0

$ npm run build
✓ built in 732ms                     # build verified, dist/ NOT committed (#188)

$ python -m compileall -q core dashboard/backend
compileall exit=0

$ git status --porcelain dashboard/frontend/dist
                                     # (empty)
$ git ls-files dashboard/frontend/dist | wc -l
7                                    # pre-existing on main, untouched
235 core (was 227: +9 new, −1 net from folding the dead-branch test), 42 backend,
65 frontend (was 61: +4), 0 failed besides the pre-existing #200 flake.
New tests, each mapped to a gap you named:
| Test | Gap it closes |
|---|---|
test_events_burn_equals_spent_for_every_algorithm |
(a) — GEPA's burn vs GEPA's Spent |
test_gepa_emits_the_cost_fields_the_burn_reads |
the emitter contract, so a dashboard-only fix can't regress it |
test_optimizer_spend_is_counted_on_locally_rejected_gepa_iterations |
the gepa_val_gate trap |
test_check_phase_never_claims_done_without_the_gate_attesting_itself |
(b) — target_profile in realistic order |
test_the_live_rate_uses_wall_clock_and_is_suppressed_when_the_log_is_stale |
(c) — the stale-log rate |
test_rate_survives_a_backwards_clock |
(d) — negative elapsed |
test_an_errored_phase_is_not_reported_as_skipped_or_done |
finding 4 |
test_a_dead_run_shows_interrupted_not_active |
(f) — the merged contradiction |
test_every_log_event_kind_in_core_is_classified_by_at_most_one_phase |
finding 5 drift |
4 frontend: liveness→interrupted, live stays active, unknown/errored rendering, fallback check |
the renderer half of the above |
On (e) — agent-mode / resume shapes. I ran a real --resume rather than a synthetic
log, and your
REAL --resume run (reopens the SAME run dir, so the original events are still there):
  kinds: baseline check_gate evaluate finalize gate_warning splits step
  phases: intake=skipped  check=done  baseline=done  optimize=done  finalize=done  report=active
baseline reads done, not skipped — --resume never starts a fresh log, so a
gepa_resume-only log isn't reachable in practice. Agent-mode's optimize=skipped is
intended: those algorithms never loop by design, and skipped beats a false pending.
Both shapes are now covered by the phase matrix in the tests.


Closes #138.
The dashboard answered "what happened" but not the four questions a user has during a run: what stage are we in, what's happening now, is it improving, and what's the honest evidence so far. Those facts existed but were spread across tabs.
What the header shows, and where each number comes from
dashboard.derive_pipeline(events)foldsevents.jsonlintosummary.pipeline={phases, current, now, burn}. The SPA renders it as one compact header above the KPI grid (EvidenceHeader.tsx); the self-containeddashboard.htmlgets the same Evidence section.title=events.jsonlevent kinds, viaderive_pipelinenow …+ time-in-stateeventstream.format_event(ev, skip_kinds=())— the terminal's own words and the terminal's own sanitiser. Time-in-state is computed viewer-side from an eventt, so a cached reduction can never serve a frozen "3m ago"cumulativeBest(graph.nodes)— the same helper the Overview chart draws, so they cannot disagreestate.jsonSpentwhen the run wrote one (burn.source == "spent"), elseeventstream.accrue_totalsover the log ("events")baseline.json→val.rewardevents.jsonlfinal.json→test.rewardThe burn is not re-derived. It uses #191's
accrue_totals, because the harness reports the same runner spend twice (evaluateatharness.py:311, restated on the followingstepat:1326) and summing every cost-ish key showed ~2x the real spend. Measured on a priced run: $0.8100 / 11,700 tok ==Spent.total_usd0.8100 ==summary.cost.total_usd0.8100 — exactly, both viaSpentand viaaccrue_totalsover the log alone. The naive sum gives $1.0200.Phase-detection mechanism
_PHASE_KINDSenumerates, per phase, every event kind that proves it started — notkind == "step", which this epic has hit four bugs from (#224). hill-climb'sstep, GEPA'sgepa_val_gate/gepa_select/gepa_local_gate/minibatch, and SkillOpt'sskillopt_step/skillopt_slow_updateall light Optimize.evaluateis deliberately absent: it fires for both the baseline eval and every candidate eval, so it cannot tell those phases apart.Status is monotone (done once a later phase started, active for the latest, pending otherwise) with a fourth state: a phase the run is already past but which logged nothing reads
skipped, notpending.cap-evolve runon a pre-scaffolded project never emitsintake, and calling that "pending" on a finalized run states something false.Two honesty fixes the first screenshot exposed
$18.69/min; it is not burning anything, it is over. Total stands; rate goes tonull(dashboard._rate).Δ vs baselineoff a ZERO baseline is shown in POINTS.reduce_runalready leavesdelta_pctnull there (a % change off zero is undefined); renderingdelta_abs * 100with a%suffix would have claimed+100.0%. It now reads+100.0 pts.Accessibility
role="img"with anaria-labelthat states the shape in words (sparklineLabel, exported so a test asserts the exact sentence a screen reader hears), and the same sentence renders as visible text beside it.prefers-reduced-motionto suppress (asserted by test).sr-onlystatus word, never colour alone (StatusBadge.tsx's in-repo pairing), witharia-current="step"on the active stage.Complementary to #118, not a second opinion: the badge answers is this process alive, the header answers what stage / what now / is it improving / what has it cost. The header never claims a run is live or done.
Also fixed here: #209 at the root
render_htmlescaped the inline-<script>payload with a one-sequence denylist (.replace("</", "<\\/")). HTML's script-data parsing also honours comment-like sequences, so a model-writtenreasoncontaining<!--<script>shifted the parser and blanked the page. Replaced withjson_for_html, matching #220's fix. Zero new deps: inline SVG for the sparkline, stdlib only in core.dist/deliberately not rebuilt (#188).Expected merge order
Branched on #191 (
feat/issue-116-follow-tail), rebased ontomain—accrue_totals/format_event/sanitizecome from there, so #191 must land first. After that, any order; the conflicts are mechanical and adjacent:--followandcap-evolve tail#191 — hard dependency (core/cap_evolve/eventstream.py).pipelineis derived fromevents.jsonlalone, so the existing(mtime_ns, size, st_ino)stamp already invalidates it exactly. Nothing wall-clock-dependent went inside the cached payload:now.sinceis an event timestamp and time-in-state is computed viewer-side.summary.algorithm, which the Optimize label consumes (Optimize · gepa); both editRunDeepDive.tsxin different places, and fix(dashboard): render the live event ticker in the SPA; populate the algorithm label #204'salgorithmevent kind is already in_PHASE_KINDS.types.ts/RunDeepDive.tsx; also brings a fulleventstream.pythat supersedes feat(observability): live terminal progress via--followandcap-evolve tail#191's, which this branch only reads from.Auxcost bar stays consistent because both it and this header trace back toSpent.cap-evolve replay) #220 (Demo-first onboarding: shareable, scrubbable run-replay artifact ("watch it before you configure") #122 replay) — also addsjson_for_html; whichever lands second drops its copy.dist/once after all frontend PRs land.Verification
Real end-to-end, zero API cost —
examples/toy_calc+ themockoptimizer, one full run per algorithm (3 iterations each, sealed test):Burn numbers asserted against the run's own records (the mock optimizer is free, so the real hill-climb log was re-priced the way a paid backend writes it —
evaluatecarries runner spend,steprestates it plusopt_cost_usd):Suites:
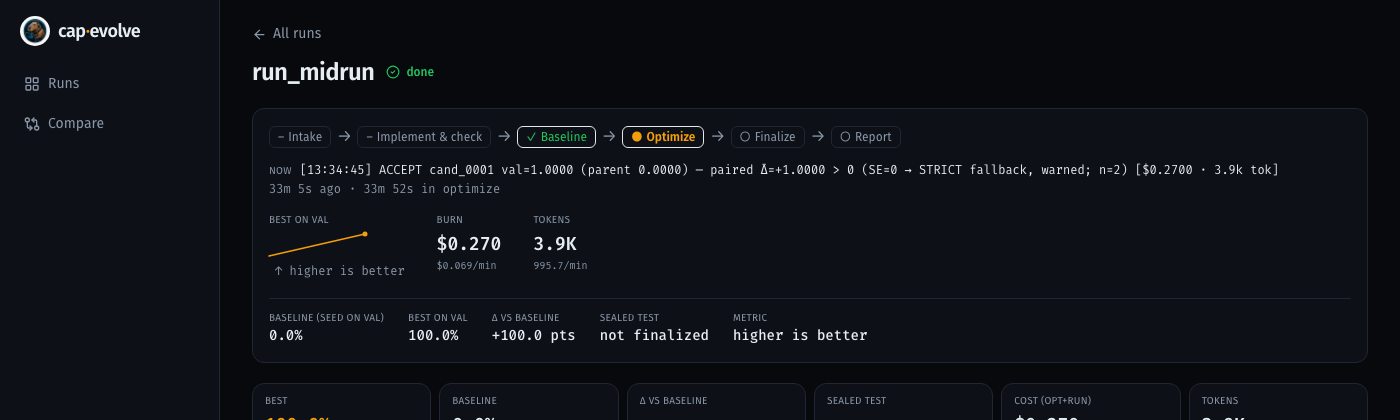
Screenshots (rendered in a real browser against a real served run dir — see the Evidence comment for the full commands and output): the finished-run header, the mid-run header with Optimize lit and a live
$0.069/minrate, and the self-containeddashboard.html.