This project is an analysis of the Ecuador exportations between 2017 and 2022, for the Devpost hackathon "Datathon TAWS 2022". You can check the hackathon details in: taws.devpost.com
Project is created with:
- Python version: 3.10
- Jupyter notebook
- Scikit-learn
- Pandas
The dataset analyzed contains the following information:
- DATE: Year and month of the exportation.
- SECTOR: Type of products exported.
- COUNTRY: Destiny country of the exportation.
- FOB: Value (in USD) of the shipped cargo, including custom fees.
- TONS: Weight of the products exported during that month.
In the notebooks folder you will find:
- data_analysis.ipynb: Preprocesing, grouping and visualization of the dataset information.
- models.ipynb: machine learning models for forecasting the FOB.
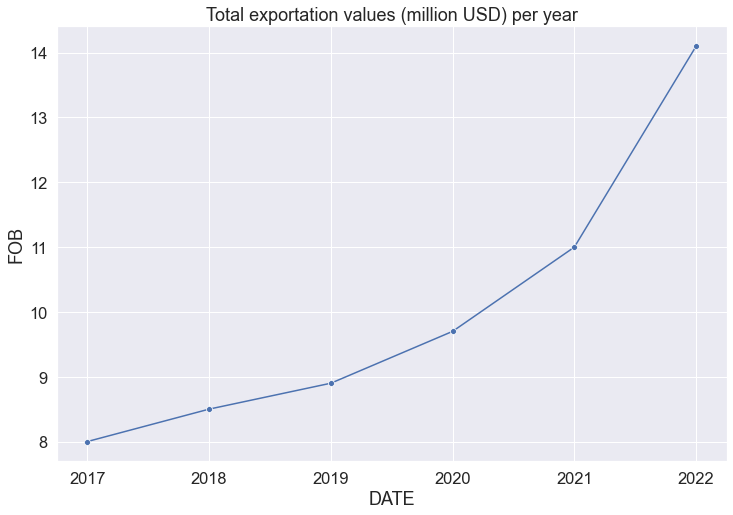
The main interest of a country when it comes to exportations is the anual money obtained from them. The following lineplot represents this information from 2017 to 2022, between January and September (since the current year 2022 has not finished yet).
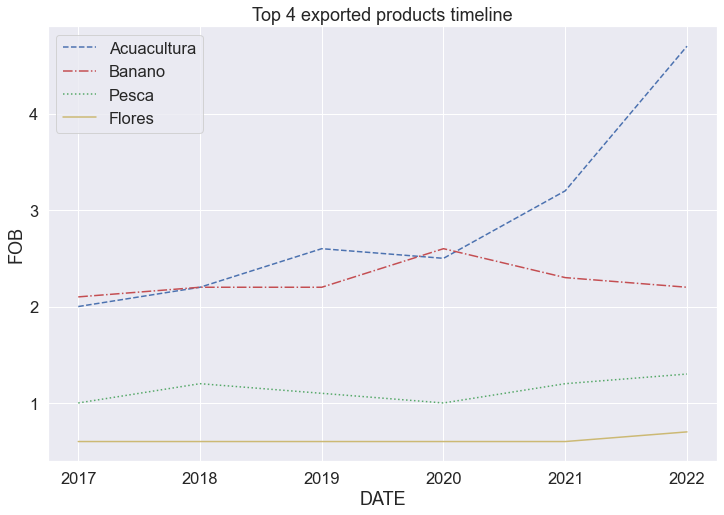
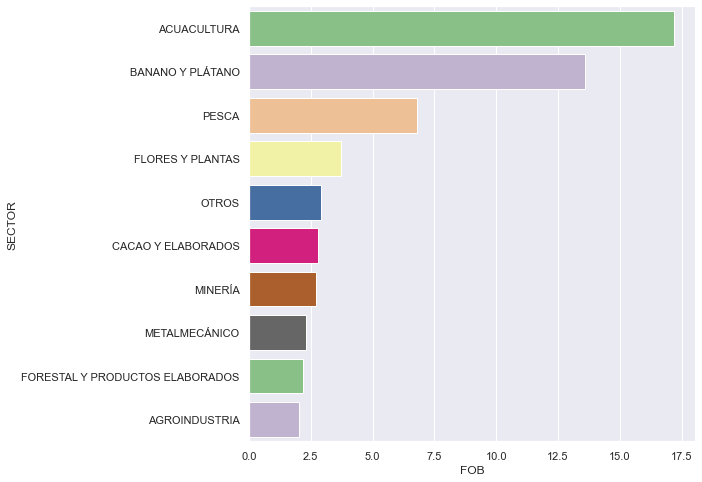
Next, the top products exported by Ecuador were obtained. The first 4 have been constant since ever as the main exportations, and seems to be the same for the last four years.
Analyzing the timeline for these 4 products, you can observe a little decrease in 2020 because of COVID-19 pandemic. However, aquaculture exportations seem to be recovered and increased in 2021 more than years before, and for the current year 2022 are better than ever. It can be said aquaculture products will remain on top in the future.