The client is a automotive manufacturing company and has provided our data analytics team to review production data for exploratory analytics to uncover isnsights that may help the manufacturing team.
The client has provided two automotive datasets for exploraotry insights. The datasets were provided in CSV Format with the following information:
| MechaCar_MPG | Suspension_Coil |
|---|---|
| vehicle_length | VehicleID |
| vehcicle_weight | Manufacturing_Lot |
| spoiler_angle | PSI |
| ground_clearance | - |
| AWD | - |
| mpg | - |
The following analysis will be performed using R Studio:
- Multiple linear regression analysis to identify which variables in the dataset predict the mpg of MechaCar prototypes
- Provide statistics on (PSI) of the suspension coils from manufacturing lots
- T-test analysis to determine if the manufacturing lots are statistically different from the mean population
- Design a statistical study to compare vehicle performance of the MechaCar vehicles against vehicles from other manufacturers, and a written intepretation/summary of each statistical analysis.
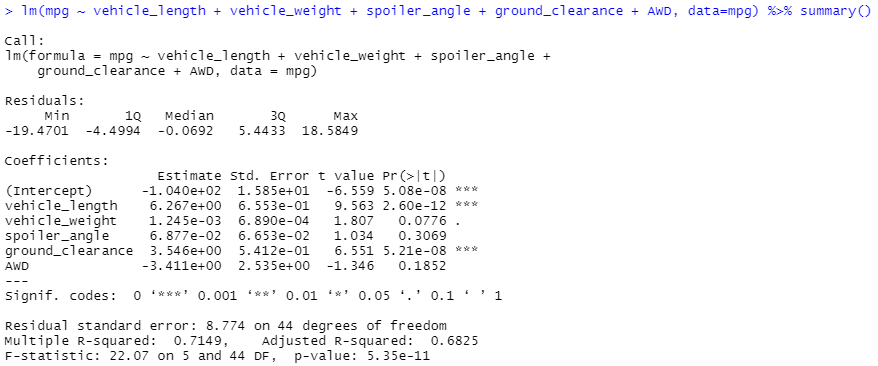
Linear modelling summary statistics of MPG data
 From the dataset, the following observations can be made:
- MPG has a dependant relationship with the variables:
Variable Correlation Pr(>|t|) vehicle_length very strong 2.60e-12 ground_clearance very strong 5.21e-8 spoiler_angle weak 0.307 - Slope of the linear model, are non-zero and are:
Variable Slope vehicle_length -1.04e+02 vehicle_weight 6.27 spoiler_angle 6.88e-02 ground_clearance 3.55 AWD -3.41 - Overall results of this linear model: the multi-variable linear regression model can be uysed to predict mpg of MechaCar prototypes. Although the results may not provide precise errors, the Multiuple R-squared value of 0.71, Adjusted R-squared value of 0.68, and p-value of 5.35e-11 is sufficiently high.
| Total_Summary Dataframe | Lot_Summary Dataframe |
|---|---|
 |
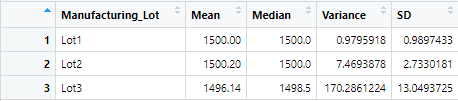 |
Variance of suspension coils must not exceed 100 PSI as per MechaCar's standards. As seen in the Lot_Summary dataframe:
| Lot | Variance | Conclusion |
|---|---|---|
| Lot1 | 0.98 | Pass |
| Lot2 | 7.47 | Pass |
| Lot3 | 170.29 | Fail |
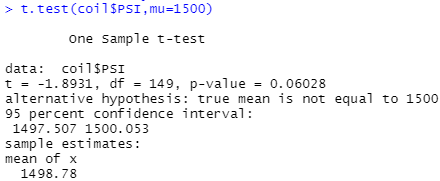
The manufacturer specifies the coils have a nominal value of 1,500 PSI. Performing a t-test across all manufacturing lots shows a p-value of 0.06, or in otherwords, the coils have a 6% chance of not being within this nominal value. As the general rule of thumb for statistcal conclusions requires a p-value of 0.05, it can be said that the manufacturing lots have a slight statistical difference from the population mean of 1500 PSI. Full results:
| Lot | T-Test | P-value | Analytical Interpretation |
|---|---|---|---|
| Lot1 | 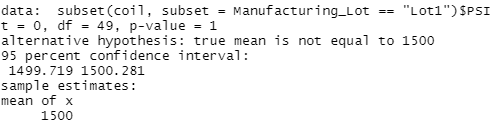 |
1 | 100% probability of hypothesis (true mean is equal to 1500 can be accepted) |
| Lot2 | 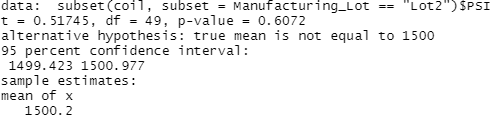 |
0.61 | 61% probability of hypothesis (true mean is equal to 1500 can neither be accepted nor rejected) |
| Lot3 | 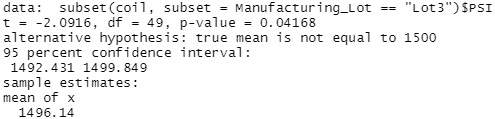 |
0.04 | 4% probability of hypothesis (true mean is equal to 1500 can be rejected) |
-
Design a statistical study to compare vehicle performance of the MechaCar vehicles against vehicles from other manufacturers
- Before designing statistcal studies, a target audience should first be determined for the values of their existing clientelle, and the vision of their market MechaCar would like to expand towards.
- For example, if MechaCar's market focus is performance, statiscal analysis showing low variability/deviation in all key performance metrics would demonstrate MechaCar's superior quality control techniques.
- However, if MechaCar's market focus are budget-concious consumers, focus can instead be given to mileage (mpg) readings.
- Under these limited conditions, it is highly recommended for MechaCar to create tailored analysis that follow the following template:
- What metrics are critical (dependent variable) to MechaCar's customer base? (i.e. MPG, aesthetics, safety, horsepower, etc.)
- What are variables that could possibly influence these metrics? And/or is competitor data with these metrics readily available for comparison?
- What statistical tests to run? Recommended test methods include: T-test for comparison of values between MechaCar and its competitors; Multiple Linear Regression is recommended if the test is to determine what variables should be changed to acheive a desired outcome.
- Hypothesis Testing: create a null and alternative hypothesis for the critical (dependent variable).
-
Example:
- Metric to Test: Towing capacity vehicle
- Dependent Variables: Weight of vehicle, size of engine
- Null Hypothesis: the weight of the vehicle and size of engine do not have an effect on a vehicle's towing capacity
- Alternative Hypothesis: The towing capacity of a vehicle may fluctuate by X% for vehicles that weigh ###-#### kgs sized with ##-### L Engines
- Statistical testing method: Multiple linear regreasion testing