


Configurable OpenTelemetry setup for .NET applications providing tracing, metrics, and logging via OTLP, configurable through code or appsettings.json.
- One-call setup — tracing, metrics and logging via a single
AddTelemetry(), configured fromappsettings.jsonor code - All three signals over OTLP — HTTP/protobuf or gRPC, to any OTLP-compatible backend
- Built-in instrumentation —
HttpClientand .NET runtime metrics everywhere; ASP.NET Core instrumentation on web targets — each toggleable. Database instrumentation is opt-in via a one-liner (see Databases) - Sensible defaults — configurable sampling, health-check path exclusion and exception recording work out of the box
- Startup validation — misconfiguration fails fast with a clear error
- Extensible —
ConfigureTracing/ConfigureMetrics/ConfigureLogginghooks for custom sources, meters and providers - Works on any .NET — ASP.NET Core, WPF, console and more; the
netstandard2.0build pulls no ASP.NET Core dependencies
- A .NET target compatible with
netstandard2.0— i.e. .NET Framework 4.6.1+, .NET 6/8/9/10, or directly thenet8.0/net10.0builds. - An OTLP-compatible backend to receive the telemetry (collector, Jaeger, OpenObserve, the .NET Aspire Dashboard, …). See Running Locally with a Backend.
- ASP.NET Core instrumentation requires a modern .NET target (
net8.0ornet10.0build); it is not included in thenetstandard2.0build used by WPF/console apps.
dotnet add package OpenTelemetryExtension.Configurationbuilder.Services.AddTelemetry(builder.Configuration);{
"Telemetry": {
"Endpoint": "http://localhost:4318",
"ServiceName": "my-api"
}
}That's it — tracing, metrics and logging are exported via OTLP.
You need an OTLP-compatible backend listening at
Endpoint. No backend yet? See Running Locally with a Backend for one-command setups.
All options live under the Telemetry key in appsettings.json.
| Property | Type | Default | Description |
|---|---|---|---|
Enabled |
bool |
true |
Set to false to disable telemetry (no OpenTelemetry services are registered). |
Endpoint |
Uri |
(required) | OTLP collector endpoint, e.g. http://localhost:4318. |
Headers |
string |
"" |
Exporter headers. Format: key1=value1,key2=value2. |
Protocol |
string |
HttpProtobuf |
HttpProtobuf (port 4318) or Grpc (port 4317). |
ServiceName |
string? |
null |
Service name shown in the backend. |
ResourceAttributes |
object |
{} |
Extra resource attributes, e.g. { "deployment.environment": "production", "team": "backend" }. |
AdditionalTracingSources |
string[] |
[] |
Extra ActivitySource names to collect (e.g. "Npgsql", your own app sources) — registered via AddSource. |
AdditionalMeters |
string[] |
[] |
Extra Meter names to collect (e.g. "MyApp.Orders") — registered via AddMeter. |
SampleRatio |
double |
1.0 |
Fraction of traces to sample. 0.1 = 10%, 1.0 = all. |
EnableTracing |
bool |
true |
Enables distributed tracing. |
EnableMetrics |
bool |
true |
Enables metrics collection. |
EnableLogging |
bool |
true |
Enables log export via OTLP. |
EnableAspNetCoreInstrumentation |
bool |
true |
Instruments incoming HTTP requests. |
EnableHttpClientInstrumentation |
bool |
true |
Instruments outgoing HttpClient requests. |
EnableRuntimeInstrumentation |
bool |
true |
Collects GC, memory and thread pool metrics. |
RecordExceptions |
bool |
true |
Records exception stack traces on spans. |
ExcludedPaths |
string[] |
["/health"] |
Paths excluded from tracing. |
IncludeScopes |
bool |
true |
Includes log scopes in exported log records. |
IncludeFormattedMessage |
bool |
true |
Includes the formatted message in exported log records. |
ConfigureTracing,ConfigureMetricsandConfigureLoggingare code-only callbacks — see Code configuration.For every key with its default value, see the Full configuration reference below.
The section defaults to Telemetry, but you can bind any section by passing its name:
builder.Services.AddTelemetry(builder.Configuration, "MyTelemetry");
// or together with a code callback:
builder.Services.AddTelemetry(builder.Configuration, o => { /* ... */ }, "MyTelemetry");
{
"MyTelemetry": {
"Endpoint": "http://localhost:4318",
"ServiceName": "my-api"
}
}Configure entirely in code instead of appsettings.json:
builder.Services.AddTelemetry(o =>
{
    o.Endpoint        = new Uri("http://localhost:4318");
    o.ServiceName     = "my-api";
    o.ResourceAttributes = new() { ["deployment.environment"] = "production" };
    o.SampleRatio     = 0.1;

    // Code-only: register additional instrumentation
    o.ConfigureTracing = tracing => tracing.AddSource("MyApp");
    o.ConfigureMetrics = metrics => metrics.AddMeter("MyApp");
    o.ConfigureLogging = logging => logging.AddConsole();
});
Or bind appsettings.json first and layer code-only options on top — both
sources are combined, and bound values can still be overridden in the callback:
builder.Services.AddTelemetry(builder.Configuration, o =>
{
    // Everything from appsettings.json is already bound here.
    o.ConfigureTracing = tracing => tracing.AddSource("MyApp");
    o.ConfigureMetrics = metrics => metrics.AddMeter("MyApp");
    o.ConfigureLogging = logging => logging.AddConsole();
});
The three callbacks are the extension points for your own telemetry. The
built-in instrumentation (ASP.NET Core, HttpClient, SQL, runtime) is wired up
automatically; these hooks let you add the signals your application emits itself.
| Hook | Builder | Used to register |
|---|---|---|
ConfigureTracing |
TracerProviderBuilder |
Activity Sources via AddSource("Name") |
ConfigureMetrics |
MeterProviderBuilder |
Meters via AddMeter("Name") |
ConfigureLogging |
ILoggingBuilder |
extra logging providers, filters, etc. |
What is a Meter?
A Meter
(from System.Diagnostics.Metrics) is the factory you create instruments
(counters, histograms, gauges) from. Each Meter has a name, and OpenTelemetry
only collects metrics from meters you have explicitly registered with
AddMeter("That.Name"). Without that call, your custom metrics are never exported.
// 1. Create a Meter and an instrument somewhere in your app
private static readonly Meter Meter = new("MyApp.Orders");
private static readonly Counter<long> OrdersPlaced = Meter.CreateCounter<long>("orders.placed");

// ... later
OrdersPlaced.Add(1);

// 2. Register the meter's name so it gets exported
o.ConfigureMetrics = metrics => metrics.AddMeter("MyApp.Orders");
What is a Source?
An ActivitySource
is the tracing equivalent: it creates Activity objects (= spans). Register its
name with AddSource("MyApp") so your custom spans are sampled and exported.
private static readonly ActivitySource Activity = new("MyApp");

using var span = Activity.StartActivity("ProcessOrder");
// ... work being traced

o.ConfigureTracing = tracing => tracing.AddSource("MyApp");
The string passed to
AddMeter/AddSourcemust exactly match the name you gave theMeter/ActivitySource— that name is how OpenTelemetry routes the data.
Database instrumentation is not built in — it depends entirely on your
driver, so it is added through the ConfigureTracing hook. This keeps the
package free of database-specific dependencies; you only pull in what you use.
// SQL Server — install the package, then register it:
//   dotnet add package OpenTelemetry.Instrumentation.SqlClient
o.ConfigureTracing = t => t.AddSqlClientInstrumentation();

// EF Core — dedicated instrumentation package:
//   dotnet add package OpenTelemetry.Instrumentation.EntityFrameworkCore
o.ConfigureTracing = t => t.AddEntityFrameworkCoreInstrumentation();

// Drivers with a built-in ActivitySource — just register its name:
o.ConfigureTracing = t => t.AddSource("Npgsql");          // PostgreSQL (Npgsql)
o.ConfigureTracing = t => t.AddSource("MySqlConnector");  // MySQL (MySqlConnector)
Oracle (Oracle.ManagedDataAccess.Core) emits an ActivitySource in recent
versions and is wired up the same way via AddSource(...).
No code for source-based drivers: if the driver only needs an ActivitySource
name (Npgsql, MySqlConnector, Oracle, your own app sources), you can enable it
purely from appsettings.json — no ConfigureTracing call required:
{
  "Telemetry": {
    "Endpoint": "http://localhost:4318",
    "AdditionalTracingSources": [ "Npgsql", "MyApp" ],
    "AdditionalMeters": [ "MyApp.Orders" ]
  }
}
Package-based instrumentation (SQL Server, EF Core) still needs the one-line
ConfigureTracingcall above, because it requires its NuGet package — a config string alone can't pull in a dependency.
Toggling SQL instrumentation from appsettings.json
Because EnableSqlClientInstrumentation is not part of TelemetryOptions (the
package is optional), you can add it as a custom key and read it in the callback:
appsettings.json:
{
  "Telemetry": {
    "Endpoint": "http://localhost:4318",
    "ServiceName": "my-api",
    "EnableSqlClientInstrumentation": true
  }
}Program.cs:
builder.Services.AddTelemetry(builder.Configuration, opt =>
    opt.ConfigureTracing = tracing =>
    {
        if (builder.Configuration.GetValue<bool>("Telemetry:EnableSqlClientInstrumentation"))
        {
            // Microsoft SQL Server / System.Data.SqlClient
            // NuGet: OpenTelemetry.Instrumentation.SqlClient
            tracing.AddSqlClientInstrumentation(sql => sql.RecordException = opt.RecordExceptions);

            // PostgreSQL (Npgsql)
            // NuGet: OpenTelemetry.Instrumentation.Npgsql
            tracing.AddNpgsql();

            // MySQL (MySqlConnector)
            // NuGet: OpenTelemetry.Instrumentation.MySqlData
            tracing.AddMySqlDataInstrumentation();
        }
    });
This keeps the on/off switch in config while the package dependency stays explicit in code.
AddTelemetry() works with any IServiceCollection — ASP.NET Core, WPF,
WinForms, console, MAUI/WinUI, UWP, worker services, etc.
With the Generic Host (recommended for desktop/console — Host.CreateApplicationBuilder()),
the providers start and flush automatically:
var builder = Host.CreateApplicationBuilder(args);
builder.Services.AddTelemetry(builder.Configuration);
using var host = builder.Build();
await host.RunAsync();   // telemetry starts here and flushes on shutdown
Without a host (e.g. a bare ServiceCollection in UWP or a minimal app),
build the provider and dispose it on exit so buffered telemetry is flushed:
var services = new ServiceCollection();
services.AddTelemetry(o =>
{
    o.Endpoint    = new Uri("http://localhost:4318");
    o.ServiceName = "my-desktop-app";
});

var provider = services.BuildServiceProvider();
// ... app runs ...
provider.Dispose();      // flushes traces, metrics and logs
ASP.NET Core instrumentation is only in the
net10.0build. On thenetstandard2.0build (WPF/WinForms/console/UWP) it is simply absent — settingEnableAspNetCoreInstrumentationthere is a harmless no-op.
Every key with its default value (only Endpoint is required to get started — telemetry is enabled by default):
Two runnable samples live under src/:
| Sample | Project | Demonstrates |
|---|---|---|
| Web API | …Sample.WebApi |
ASP.NET Core minimal API configured from appsettings.json, ready-to-run backend profiles, EF Core and opt-in SQL instrumentation. |
| WPF | …Sample.Wpf |
Desktop app wiring AddTelemetry() through the Generic Host, emitting a custom ActivitySource/Meter and an HttpClient span on a button click. |
The Web API sample drives the backend walkthrough below; the WPF sample exports
to http://localhost:4318 by default — point it at any of the backends here.
The Web API sample ships
ready-to-run configurations for several popular backends (the three below are
documented in full; more start scripts live in infrastructure/). Each backend has:
- an infrastructure start script (Docker Compose or Helm) in
infrastructure/, - a launch profile that selects the matching
appsettings.<env>.json, - a UI where the exported traces, metrics and logs show up.
- Start the backend infrastructure — run the script for your backend (see table).
- Docker scripts live in
infrastructure/dockerand need Docker. - Helm scripts live in
infrastructure/helmand need a local Kubernetes cluster (e.g. k3s in WSL2).
- Docker scripts live in
- Run the sample with the matching profile:
Or pick the profile from the run dropdown in Visual Studio / Rider.
cd src/OpenTelemetryExtension.Configuration.Sample.WebApi dotnet run --launch-profile "Start Aspire"
- Generate traffic — the app opens Swagger at
https://localhost:5073/swagger; call an endpoint. - Open the backend UI (see table) to inspect the telemetry.
| Backend | Start infrastructure | Launch profile | Backend UI |
|---|---|---|---|
| .NET Aspire Dashboard | infrastructure/docker/docker-install-aspire-dashboard.cmd (or Helm: helm/helm-install-aspire-dashboard.cmd) |
Start Aspire |
http://localhost:31888 |
| Jaeger | infrastructure/docker/docker-install-jaeger.cmd |
Start Jaeger |
http://localhost:16686 |
| OpenObserve | infrastructure/helm/helm-install-openobserve.cmd |
Start OpenObserve Http / Start OpenObserve Grpc |
http://localhost:30117 (admin@web.de/admin) |
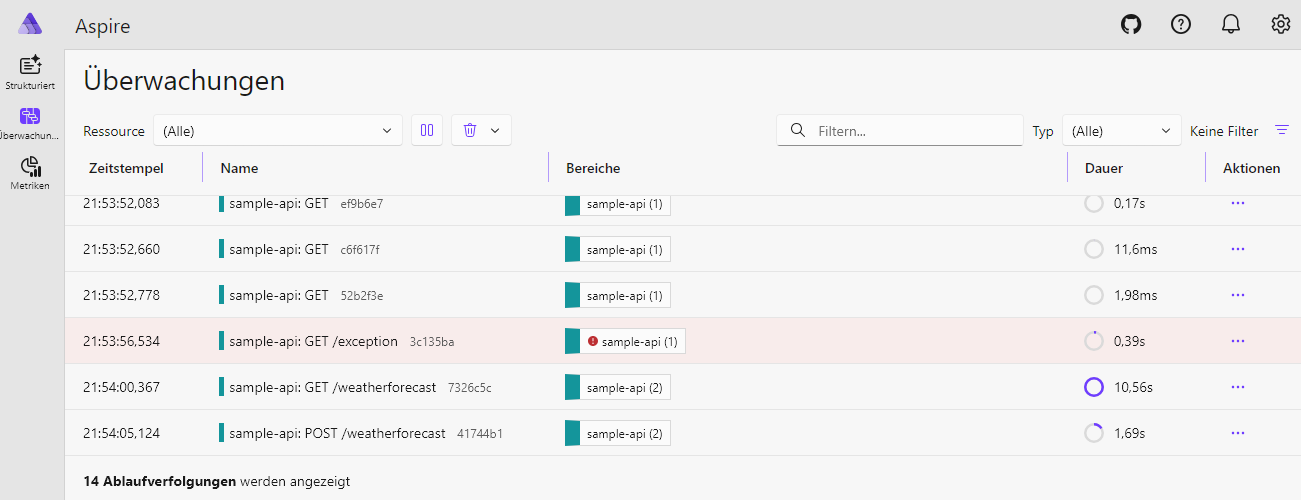
Tip — viewing logs in the Aspire Dashboard: after starting the app with the
Start Aspireprofile, open http://localhost:31888, then go to the Structured (logs), Traces or Metrics tab. Data appears as soon as you hit a Swagger endpoint.
These are the exact appsettings.<env>.json files used by the sample's launch profiles.
The dashboard requires an API key on the OTLP endpoint (x-otlp-api-key). The
gRPC endpoint is exposed on NodePort 31889 (Helm) or host port 31889 (Docker).
{
"Telemetry": {
"Protocol": "Grpc",
"Endpoint": "http://localhost:31889",
"Headers": "x-otlp-api-key=aspire"
}
}Traces, metrics and logs from the sample app shown live in the Aspire Dashboard UI:
{
"Telemetry": {
"Protocol": "Grpc",
"Endpoint": "http://localhost:4317"
}
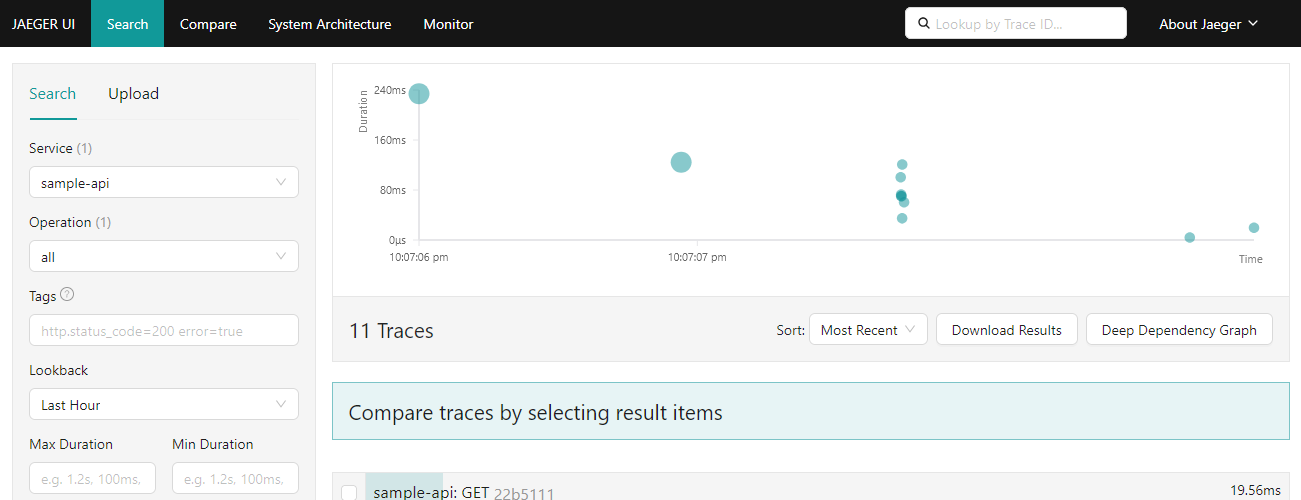
}Traces from the sample app shown in the Jaeger UI:
{
"Telemetry": {
"Protocol": "HttpProtobuf",
"Endpoint": "http://localhost:30117/api/default",
"Headers": "Authorization=Basic YWRtaW5Ad2ViLmRlOmFkbWlu,stream-name=default"
}
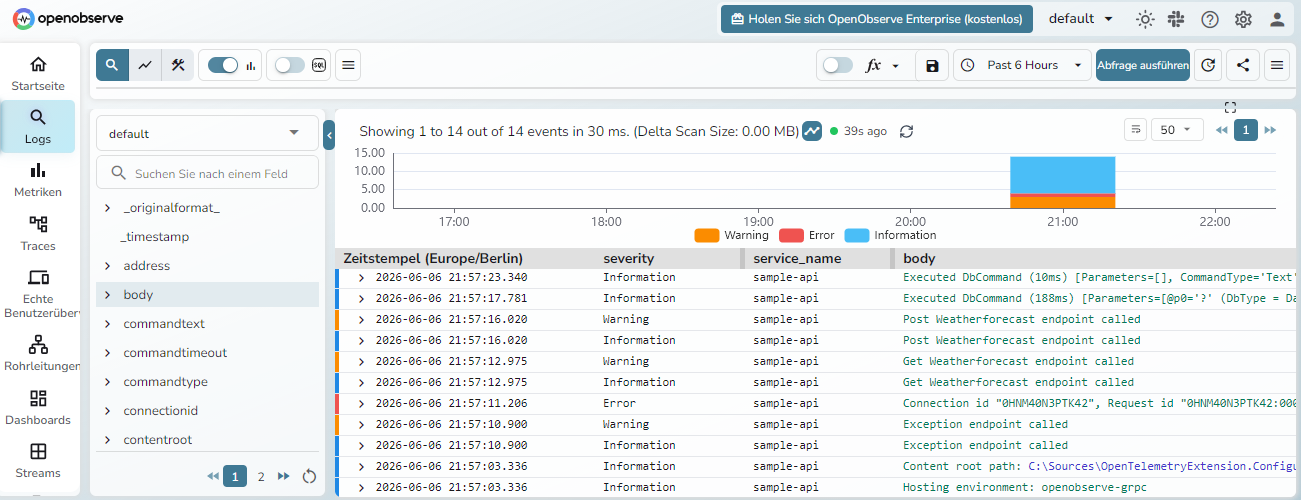
}The same telemetry explored in the OpenObserve UI:
- OpenTelemetry .NET — official docs · GitHub
- .NET observability (Microsoft Learn) — Metrics · Distributed tracing · Logging
- APIs —
Meter·ActivitySource - OTLP exporter — configuration reference · environment variables
See CONTRIBUTING.md.
{
  "Telemetry": {
    "Enabled": true,                           // master switch — set false to disable
    "Endpoint": "http://localhost:4318",       // OTLP collector endpoint (required)
    "Headers": "",                             // exporter headers: "key1=value1,key2=value2"
    "Protocol": "HttpProtobuf",                // "HttpProtobuf" (4318) or "Grpc" (4317)
    "ServiceName": null,                        // service name shown in the backend
    "ResourceAttributes": {},                   // extra attributes, e.g. { "deployment.environment": "production" }
    "AdditionalTracingSources": [],             // extra ActivitySource names, e.g. [ "Npgsql", "MyApp" ]
    "AdditionalMeters": [],                     // extra Meter names, e.g. [ "MyApp.Orders" ]
    "SampleRatio": 1.0,                         // 0.1 = 10% of traces, 1.0 = all
    "EnableTracing": true,                      // distributed tracing
    "EnableMetrics": true,                      // metrics collection
    "EnableLogging": true,                      // log export via OTLP
    "EnableAspNetCoreInstrumentation": true,    // incoming HTTP requests
    "EnableHttpClientInstrumentation": true,    // outgoing HttpClient requests
    "EnableRuntimeInstrumentation": true,       // GC, memory, thread pool metrics
    "RecordExceptions": true,                   // exception stack traces on spans
    "ExcludedPaths": [ "/health" ],             // paths excluded from tracing
    "IncludeScopes": true,                      // log scopes in exported records
    "IncludeFormattedMessage": true             // formatted message in exported records
  }
}