Conversation
|
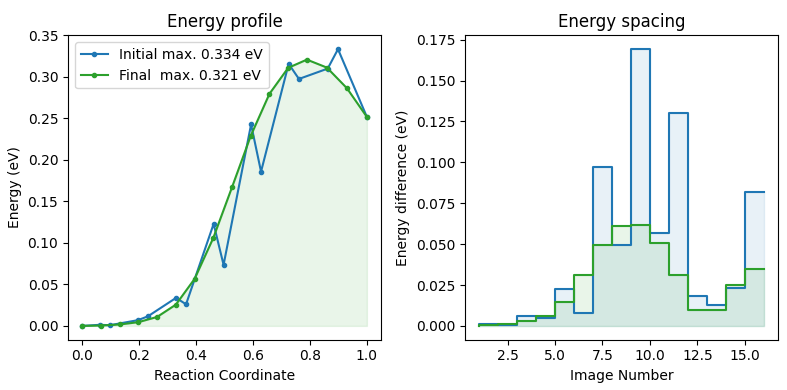
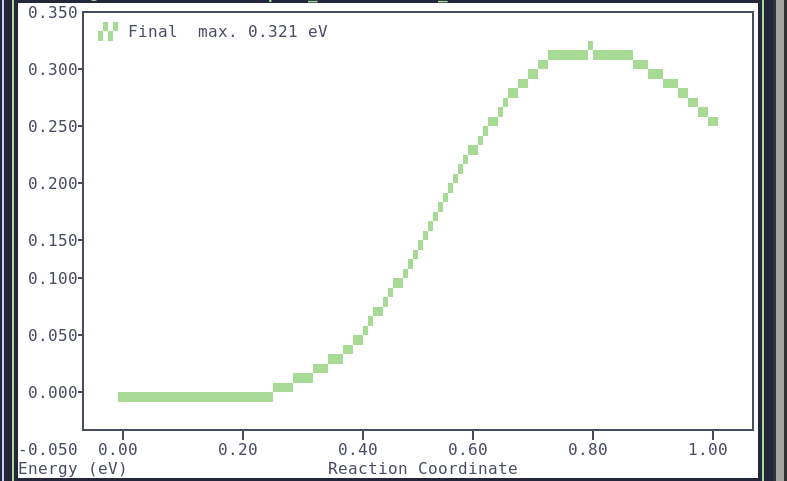
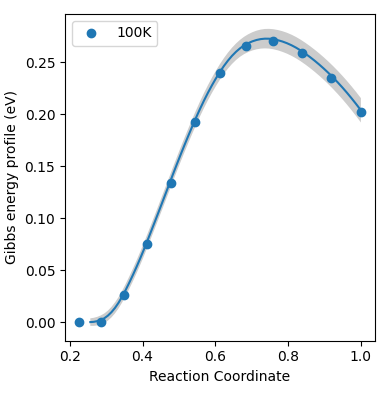
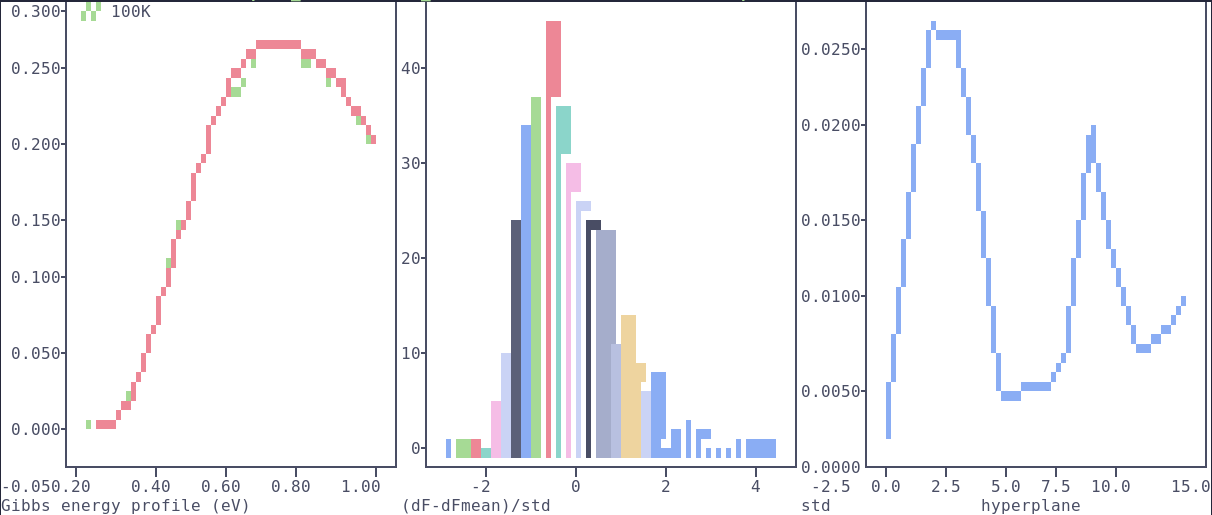
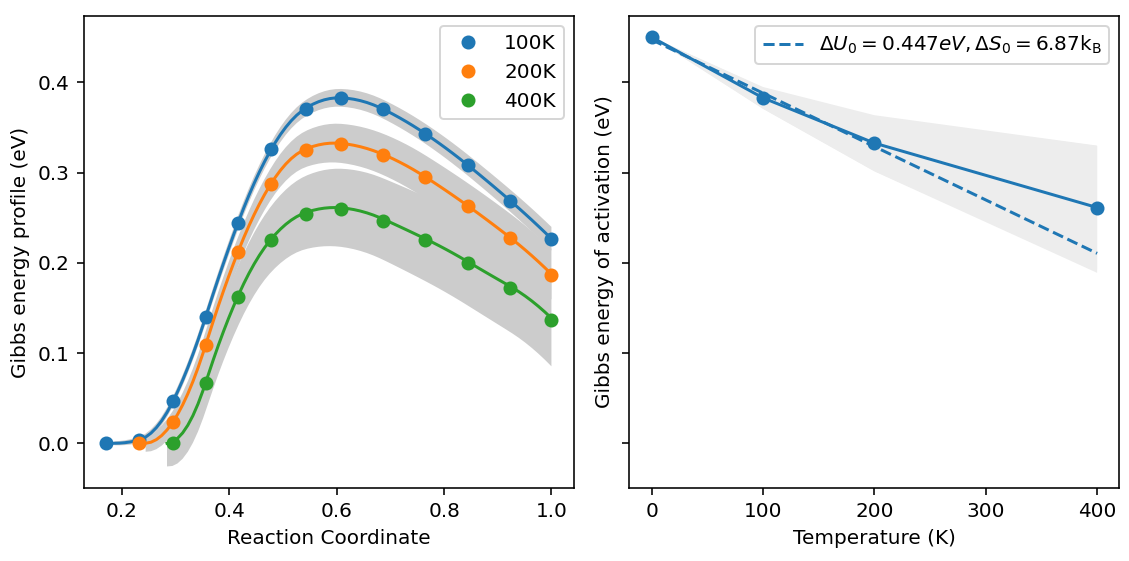
I organized the post-processing scripts I use the most in a CLI interface. It is installable for easier use ( Gallery NEB Relaxation with inter-replica energy spacing ( Energy profile at the final stage of a NEB, plotted in terminal using plotext (flags Simple plot of a PAFI run (default settings with Same profile along with an histograp of error and a plot of std, directly inside the terminal ( Evolution of the free energy versus temperature. Files are caught using a glob expression, an arbitrary value of 0.45 is added for 0K, and a linear model is fitted to the data up to 200K ( General usage: pafi_plot [-h] {neb,NEB,pafi,PAFI} ...
options:
-h, --help show this help message and exit
Available modes:
{neb,NEB,pafi,PAFI}
neb (NEB) Plot the energy profile from a NEB log.lammps file.
pafi (PAFI) Plot the free energy profile from a PAFI run using a
raw_ensemble_output file.
NEB Mode usage: pafi_plot neb [-h] [-f] [-C N] [-n] [-N] [-E] [-R] [--print-profile]
[-t] [-s SAVE] [-q] [--size SIZE]
log_lammps
positional arguments:
log_lammps log.lammps file from a NEB run
options:
-h, --help show this help message and exit
-f, --final Only display the final stage of the relaxation.
Otherwise, profiles at the initial and pre-climb
stages are also shown.
-C N, --cut-at-image N
If N is specified, only the first N images will be
shown.
-n, --normalize-r Normalize r such that its maximum value is 1.0
-N, --image-number Show image number instead of reaction coordinate on
the x axis
-E, --energy_diff Add a subplot showing the spacing of points on the
Energy axis. Useful to spot large gaps in energy that
would cause a large error for PAFI integration.
-R, --rcdiff Add a subplot showing the spacing of points on the r
axis. Useful to spot large gaps in reaction
coordinate.
--print-profile Print NEB profile raw data to terminal.
-t, --terminal Experimental: use plotext as backend for display in
terminal.
-s SAVE, --save SAVE name of a file destination (e.g. "plot.pdf",
"plot.png")
-q, --quiet Do not open matplotlib popup nor display in terminal.
--size SIZE Scaling factor of the figure passed to matplotlib
(default is 4).
PAFI Mode usage: pafi_plot pafi [-h] [--mode {s,m}] [--H0 H0] [--no-fit] [--hist]
[--std] [--harmonic-limit HARMONIC_LIMIT] [-t] [-s SAVE]
[-q] [--size SIZE]
file
positional arguments:
file A PAFI raw_ensemble_output file, or a glob expression
that matches a list of raw_ensemble_output files.
options:
-h, --help show this help message and exit
--mode {s,m} either plot a single or multiple raw files.
--H0 H0, --zero H0 A value for 0K, e.g obtained from NEB.
--no-fit Disable fitting DeltaS on the harmonic domain.
--hist Plot an histogram of dF.
--std Plot std for each hyperplane.
--harmonic-limit HARMONIC_LIMIT
The upper temperature limit above which the entropy is
considered non-linear. System dependant.
-t, --terminal Experimental: use plotext as backend for display in
terminal.
-s SAVE, --save SAVE name of a file destination (e.g. "plot.pdf",
"plot.png")
-q, --quiet Do not open matplotlib popup nor display in terminal.
--size SIZE Scaling factor of the figure passed to matplotlib
(default is 4).
|
Script to process raw files.