Visualization Dashboard
Interactive web-based dashboard for exploring SuperLocalMemory v2.2.0 visually - Timeline views, semantic search explorer, knowledge graph visualization, and real-time analytics.
Keywords: visualization dashboard, web UI, timeline view, search explorer, graph visualization, memory analytics, interactive dashboard
Watch the full dashboard walkthrough (2 minutes):
https://superlocalmemory.com/assets/videos/dashboard-tour.mp4
The Visualization Dashboard (new in v2.2.0) provides an interactive web interface for exploring your memories, discovering patterns, and visualizing relationships. Built with Dash/Plotly for professional-grade interactive visualizations.
| Challenge | Dashboard Solution |
|---|---|
| "I have 1,000+ memories" | Timeline view shows all memories chronologically |
| "Can't visualize relationships" | Interactive graph shows clusters and connections |
| "Search is text-only" | Visual search explorer with score bars |
| "Want to see trends" | Analytics dashboard with charts and insights |
| "Need to explore clusters" | Click clusters to see all related memories |
- 📈 Timeline View - Chronological visualization with importance indicators
- 🔍 Search Explorer - Real-time semantic search with visual scoring
- 🕸️ Graph Visualization - Interactive knowledge graph with zoom/pan
- 📊 Statistics Dashboard - Memory trends, tag clouds, pattern insights
- 🎯 Advanced Filters - Filter by tags, importance, date range, clusters
- 🌓 Dark Mode - Easy on the eyes for long sessions
- 📱 Responsive - Works on desktop, tablet, mobile
# Install optional dependencies (if not already installed)
pip install dash plotly pandas networkx

# Or install all at once
pip install -r requirements-dashboard.txt# Start the dashboard server
python ~/.claude-memory/ui_server.py
# Dashboard opens at: http://localhost:8765Expected output:
╔══════════════════════════════════════════════════════════════╗
║  SuperLocalMemory v2.2.0 - Visualization Dashboard           ║
╚══════════════════════════════════════════════════════════════╝

✓ Database loaded: 523 memories
✓ Knowledge graph loaded: 8 clusters, 312 entities
✓ Pattern data loaded: 24 learned patterns

🌐 Dashboard running at: http://localhost:8765
🔧 Press Ctrl+C to stop server

[2026-02-07 14:30:00] Dash app starting...
Custom port:
python ~/.claude-memory/ui_server.py --port 8080Specific profile:
python ~/.claude-memory/ui_server.py --profile workDebug mode:
python ~/.claude-memory/ui_server.py --debugVisualize all your memories chronologically with importance indicators, clusters, and quick actions.
| Feature | Description |
|---|---|
| Chronological display | All memories sorted by date |
| Importance markers | Color-coded by importance (1-10) |
| Cluster badges | Shows which cluster each memory belongs to |
| Hover tooltips | Full content preview on hover |
| Click to expand | View full memory details |
| Date range filter | Filter by custom date ranges |
| Zoom controls | Focus on specific time periods |
Importance levels:
- 🔴 Critical (9-10) - Red markers
- 🟠 High (7-8) - Orange markers
- 🟡 Medium (4-6) - Yellow markers
- 🟢 Low (1-3) - Green markers
1. Review recent work:
Select: "Last 7 days"
See: All memories from this week
Action: Quick context refresh
2. Analyze project history:
Select: Custom range (Jan 1 - Feb 7)
See: All project memories
Action: Generate project summary
3. Find forgotten decisions:
Scroll: Timeline to 3 months ago
See: Old architectural decisions
Action: Recall reasoning
Timeline View - Full:
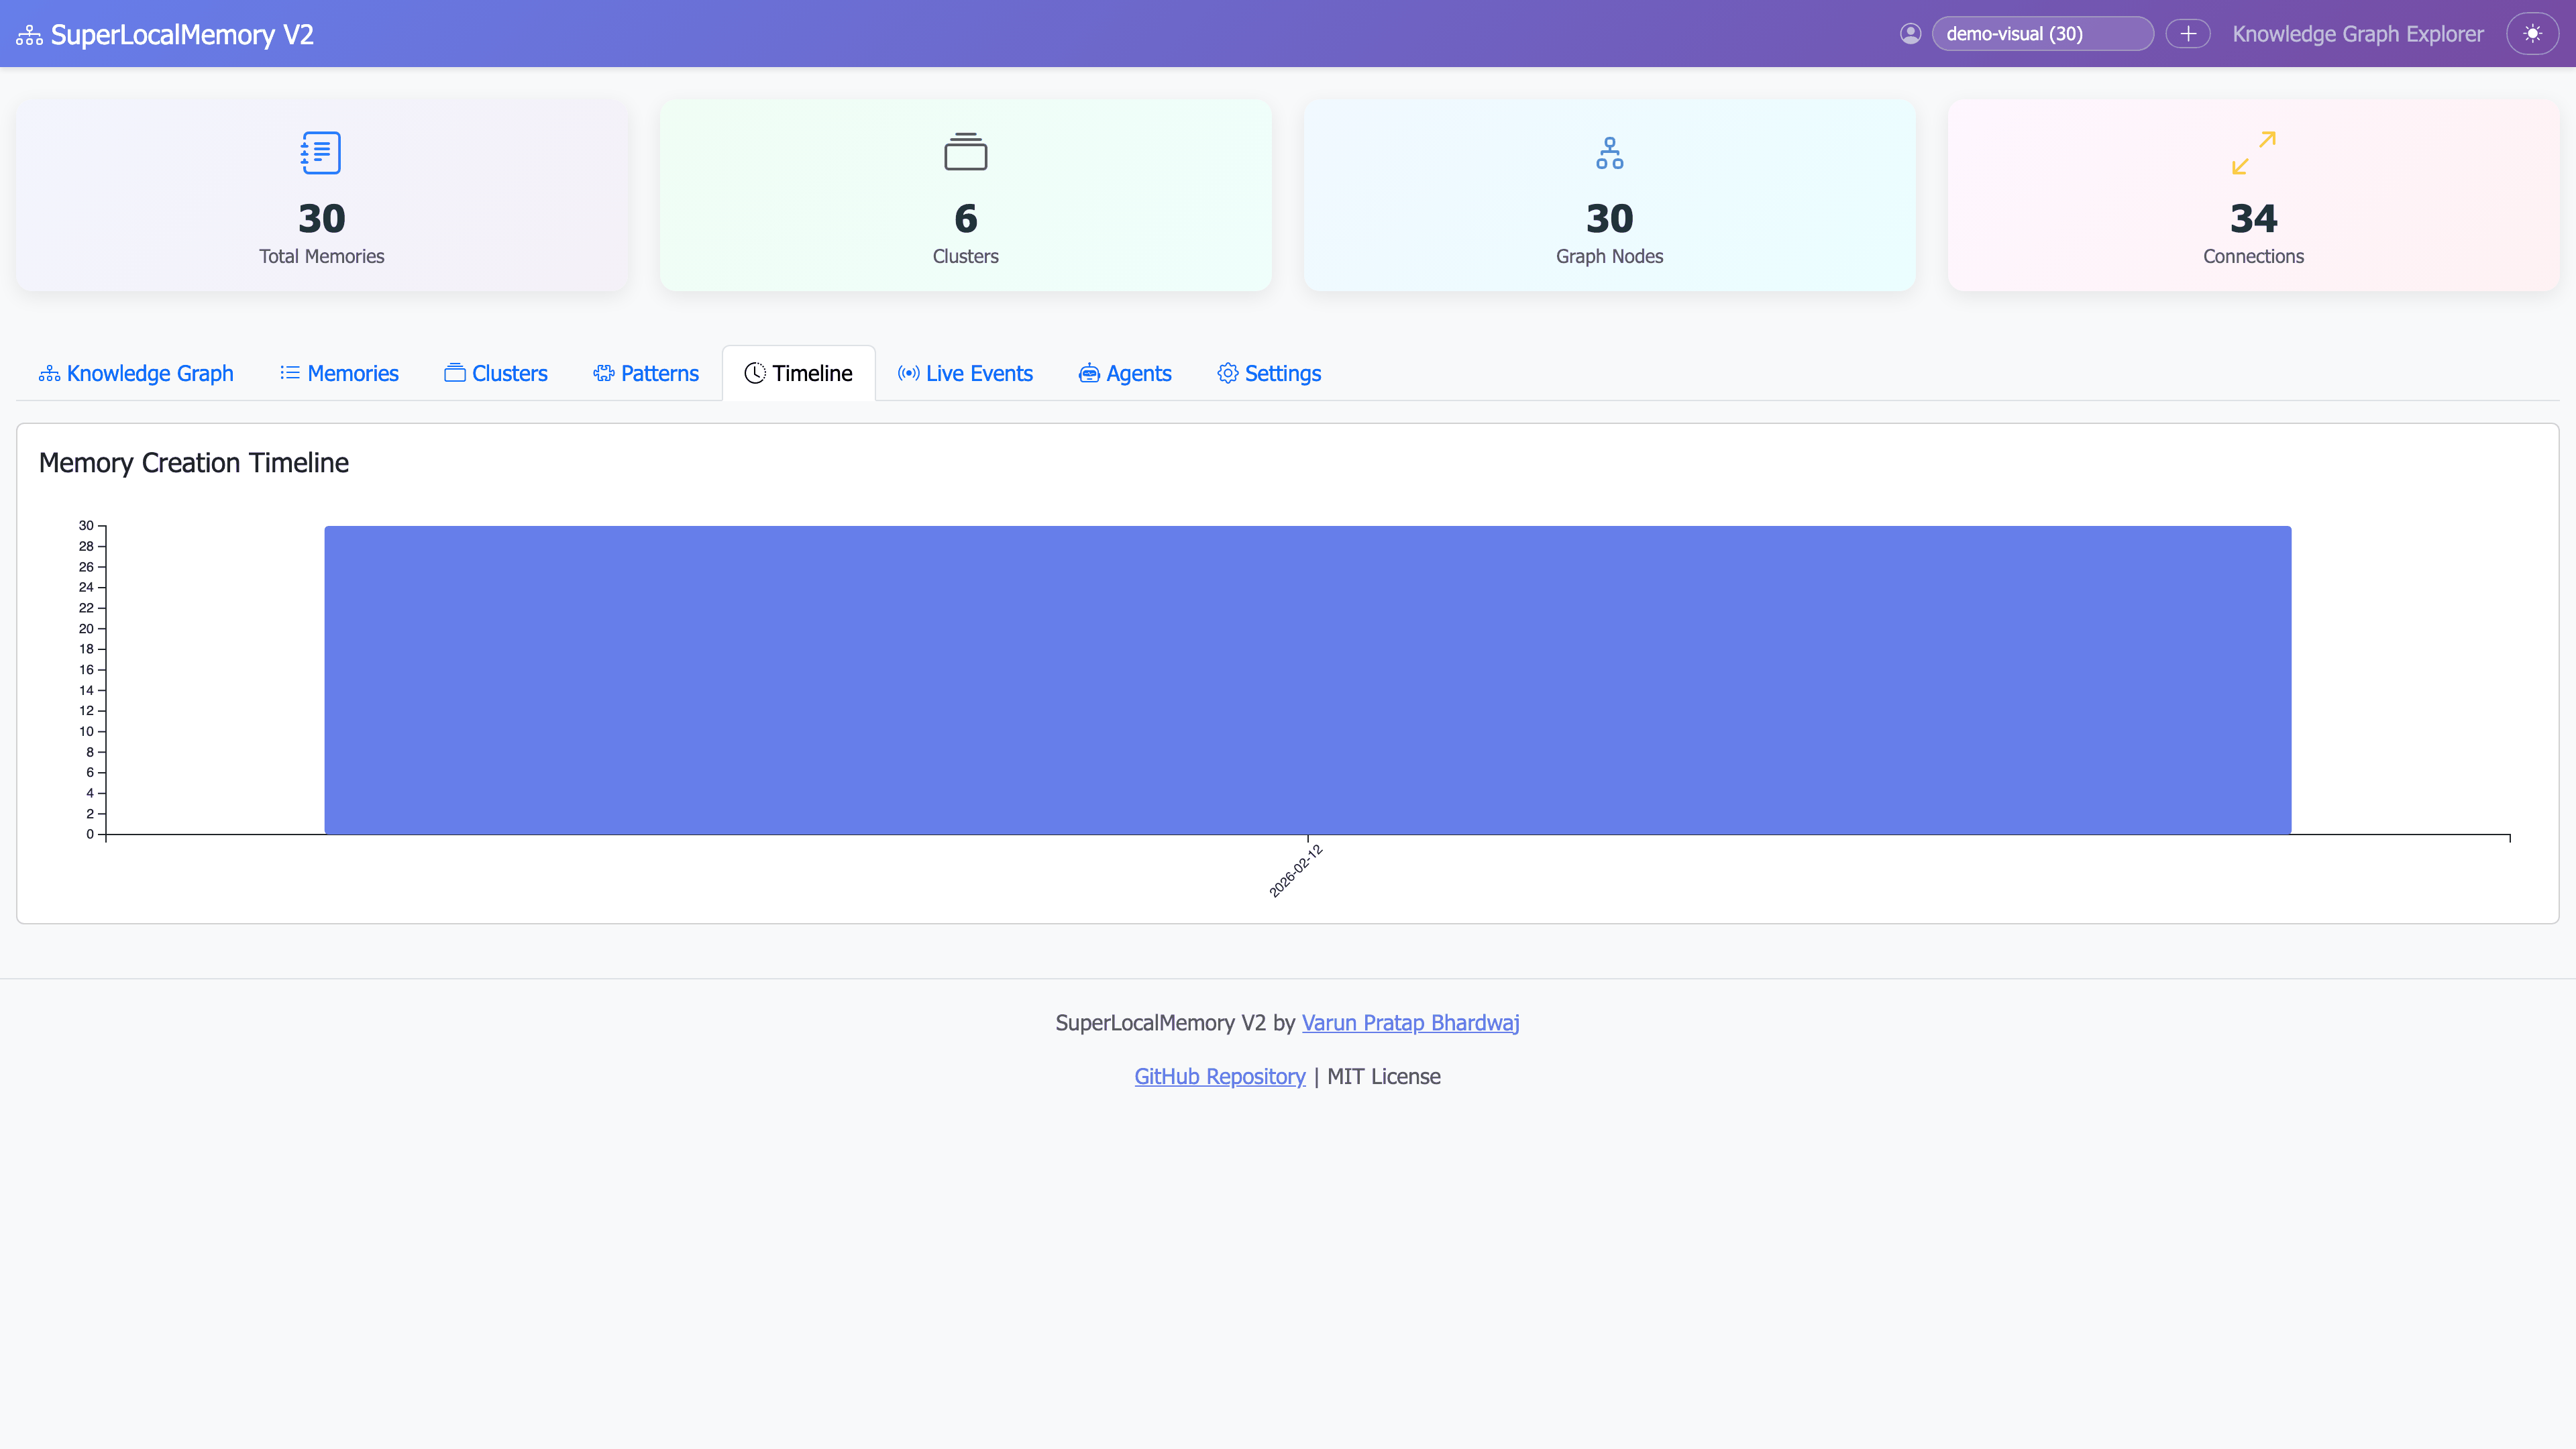
Full timeline showing all memories with importance color coding and chronological organization
Timeline View - Filtered:

Filtered to last 30 days, showing cluster-organized memories
Memory Cards - Detail View:
Expanded memory cards showing content, tags, clusters, and importance scores
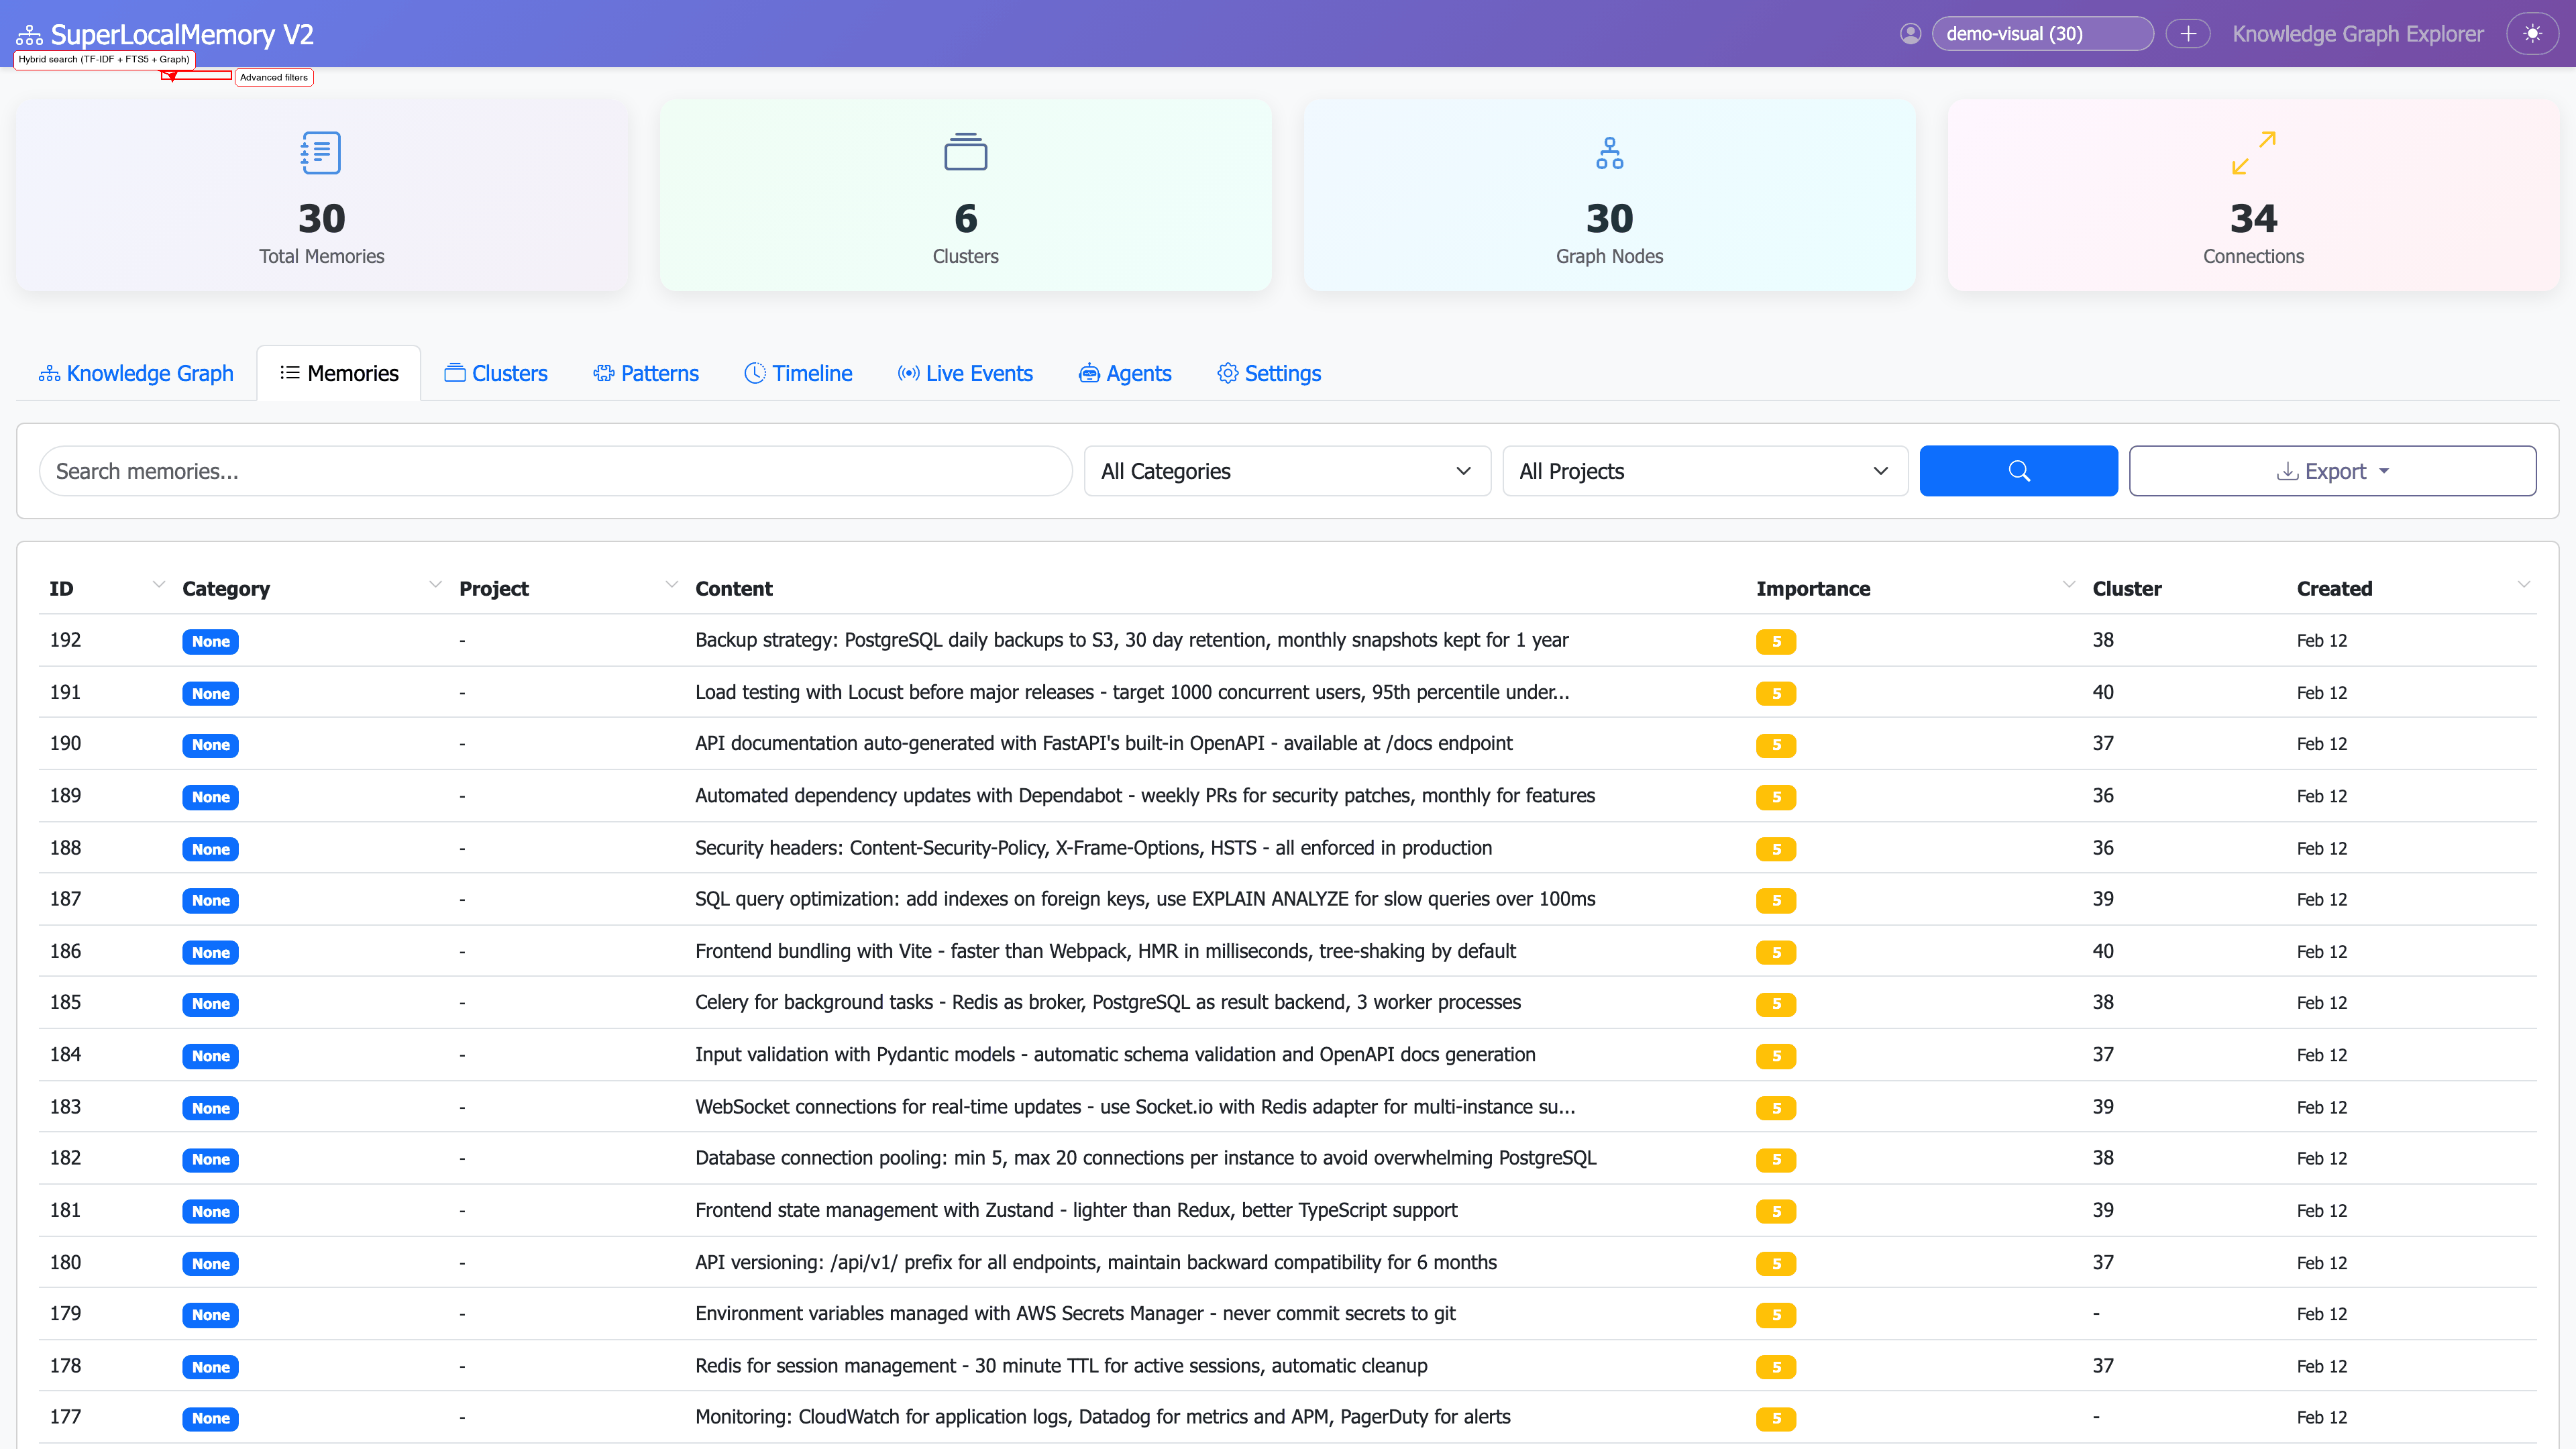
Real-time semantic search with visual score indicators, multiple search strategies, and instant results.
| Feature | Description |
|---|---|
| Live search | Results update as you type |
| Hybrid search | Semantic + FTS5 + Graph combined |
| Score visualization | Visual bars showing relevance (0-100%) |
| Search strategy toggle | Switch between semantic/exact/graph/hybrid |
| Result highlighting | Matched keywords highlighted |
| Cluster context | Shows related cluster for each result |
| Export results | Download search results as JSON/CSV |
1. Semantic Search (TF-IDF)
Query: "authentication patterns"
Matches: JWT implementation, OAuth flow, session management
How: Finds conceptually similar content
Speed: ~45ms
2. Full-Text Search (FTS5)
Query: "PostgreSQL 15"
Matches: Exact phrase "PostgreSQL 15"
How: Literal text matching
Speed: ~30ms
3. Graph-Enhanced Search
Query: "security"
Matches: All memories in "Auth & Security" cluster
How: Knowledge graph traversal
Speed: ~60ms
4. Hybrid Search (Default)
Query: "API design"
Matches: Best results from all three strategies
How: Combines and ranks all methods
Speed: ~80ms
Score bars show relevance:
- 90-100% - Perfect match (green)
- 70-89% - High relevance (yellow)
- 50-69% - Medium relevance (orange)
- Below 50% - Low relevance (red)
Filters available:
- Minimum score threshold (slider: 0-100%)
- Date range (calendar picker)
- Tags (multi-select dropdown)
- Importance level (1-10 slider)
- Clusters (multi-select)
- Projects (dropdown)
1. Find related concepts:
Search: "authentication"
Strategy: Semantic
Results: JWT, OAuth, sessions, tokens, CSRF
2. Exact phrase lookup:
Search: "expires after 24 hours"
Strategy: FTS5
Results: Exact matches only
3. Explore cluster:
Search: "React"
Strategy: Graph
Results: All React-related via cluster
Search Explorer - Live Search:

Real-time search as you type with instant results and hybrid scoring
Search Results - Score Visualization:
Visual score bars showing relevance percentages with color-coded importance
Advanced Filters:
Advanced filter panel showing date range, tags, importance, and cluster filters
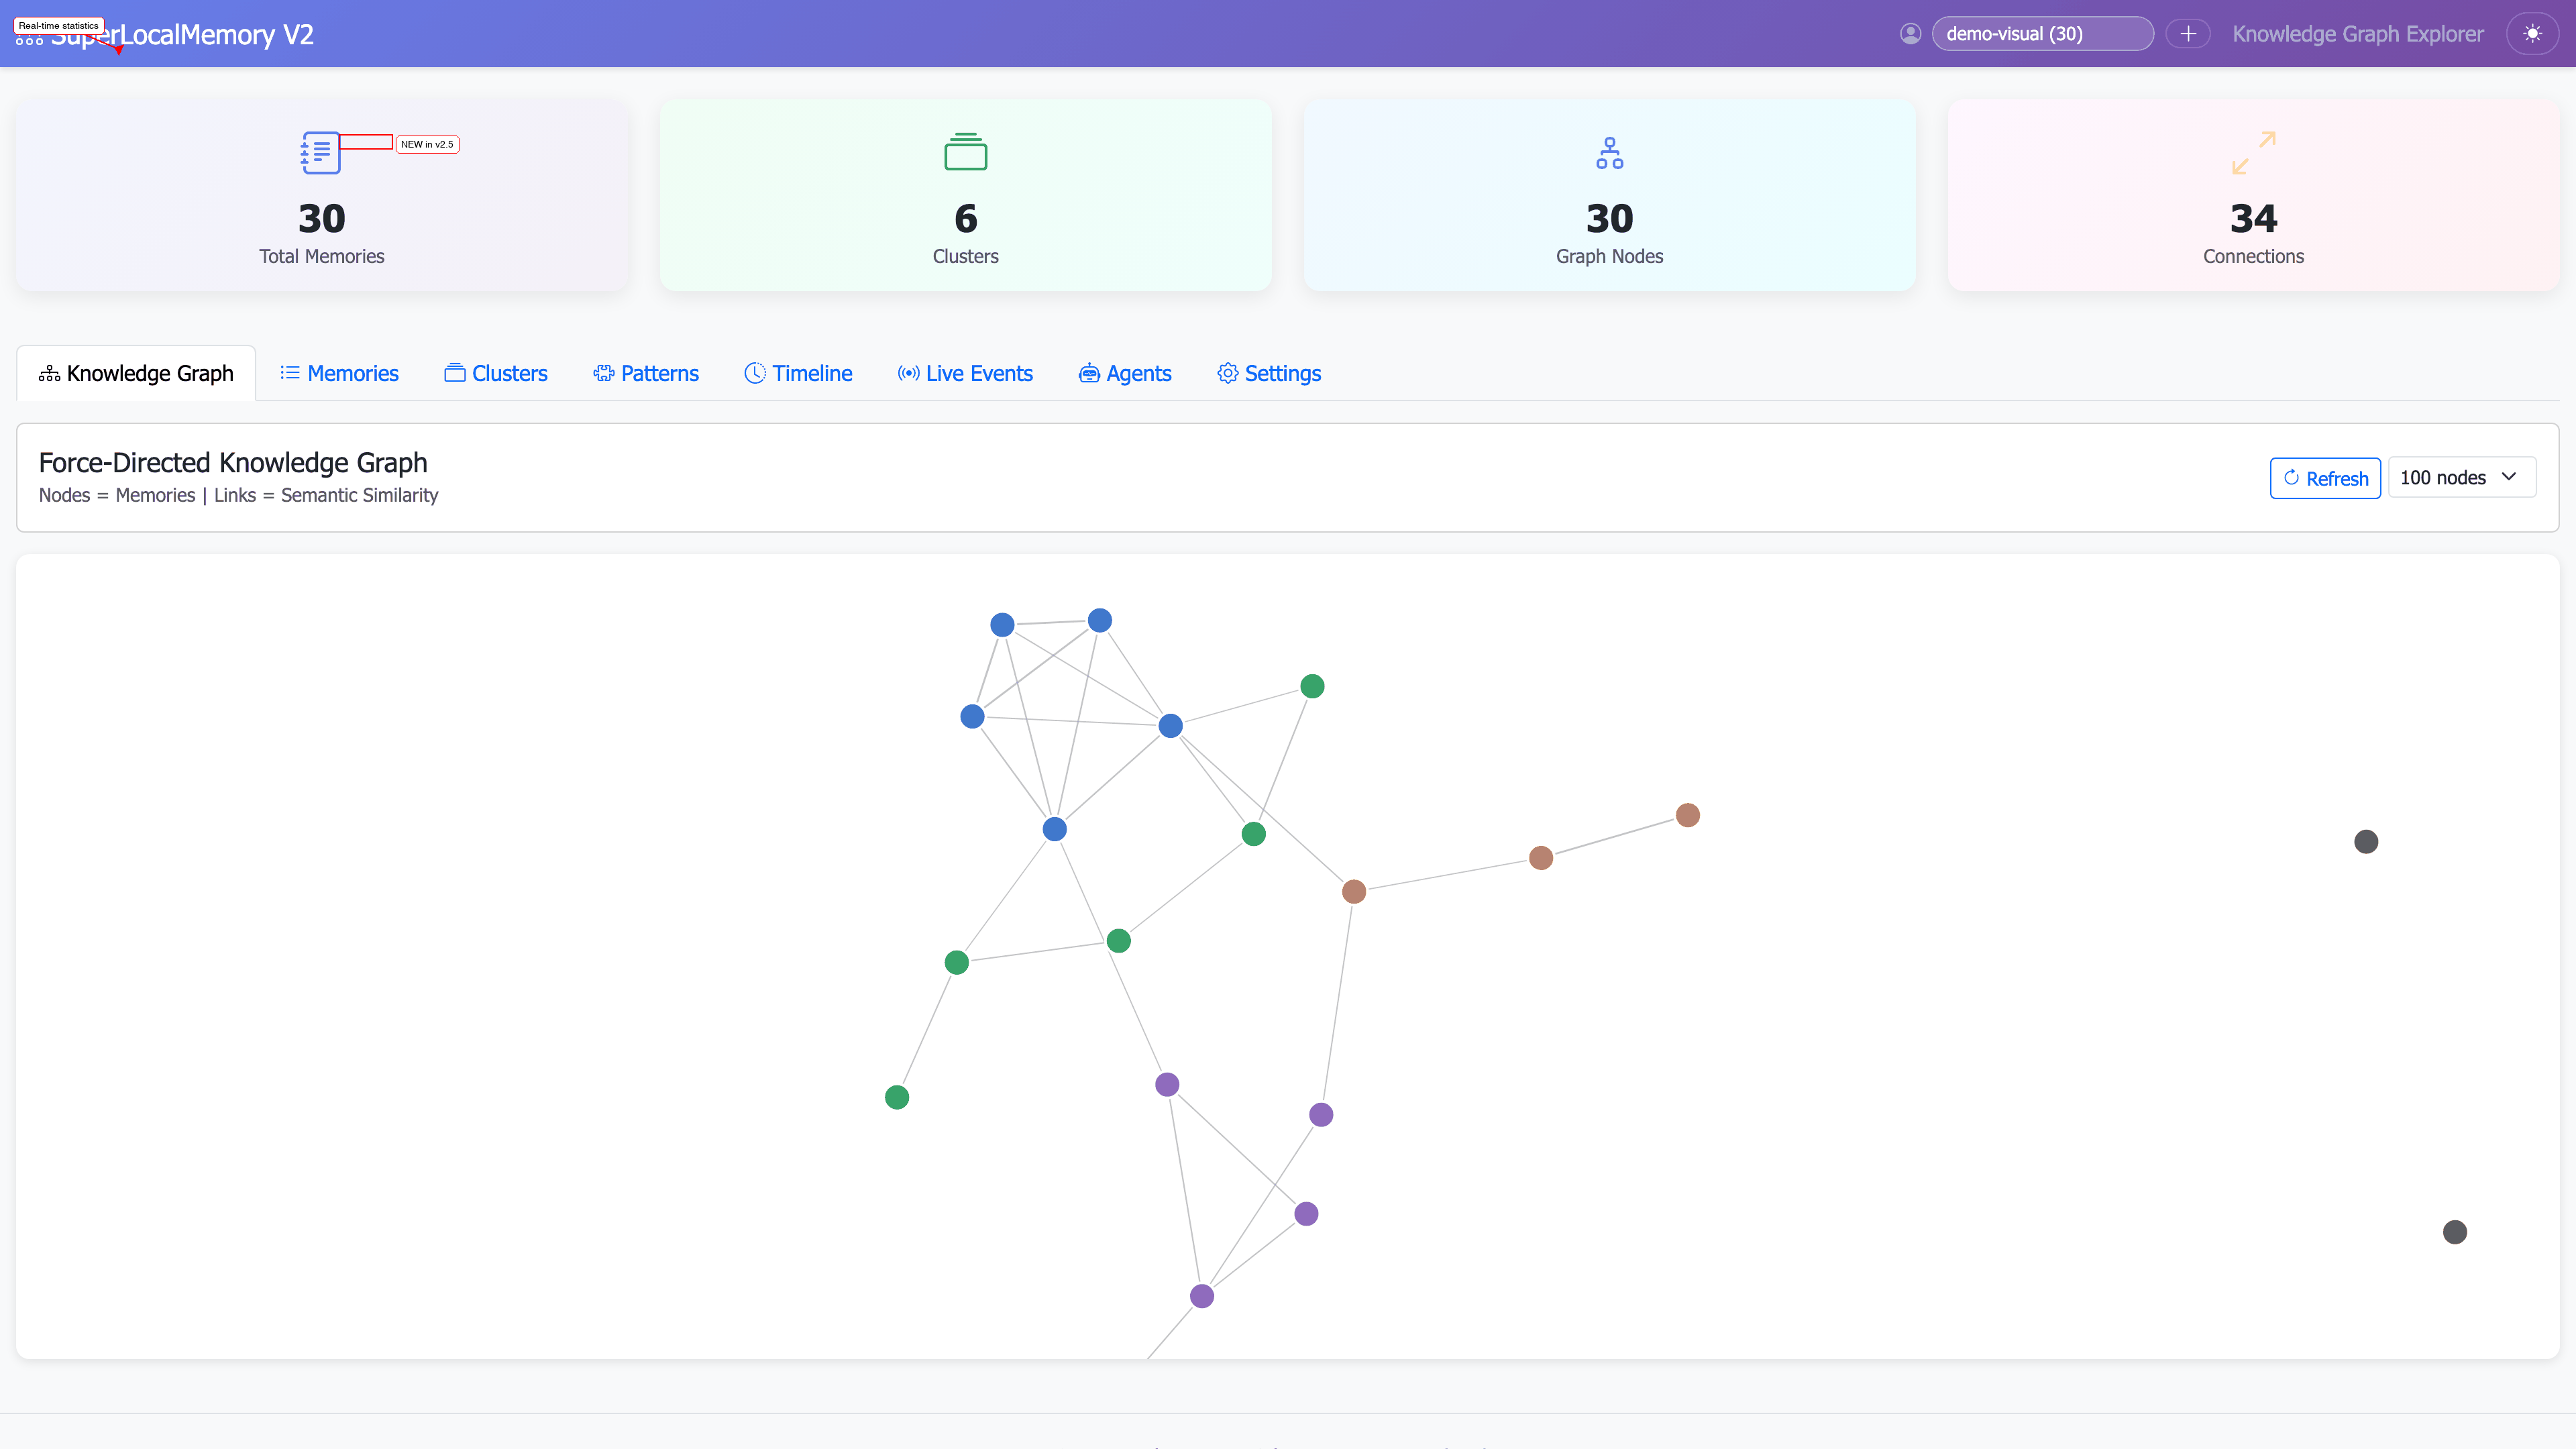
Interactive knowledge graph showing clusters, entities, and relationships with zoom, pan, and click-to-explore.
| Feature | Description |
|---|---|
| Interactive graph | Zoom, pan, drag nodes |
| Cluster coloring | Each cluster has unique color |
| Edge weights | Thicker edges = stronger relationships |
| Node sizing | Larger nodes = more connections |
| Click to focus | Click cluster to see members |
| Hover details | Node/edge info on hover |
| Layout algorithms | Force-directed, circular, hierarchical |
| Export graph | Save as PNG/SVG |
Nodes:
- Clusters - Large colored circles
- Entities - Smaller circles connected to clusters
- Memories - Smallest circles (linked to entities)
Edges:
- Cluster relationships - Dotted lines
- Entity connections - Solid lines
- Memory links - Thin lines
Colors:
- Each cluster automatically assigned unique color
- Related clusters have similar color shades
- Isolated nodes shown in gray
1. Force-Directed (Default)
Best for: General exploration
Behavior: Related nodes attract, unrelated repel
Use case: Discovering hidden relationships
2. Circular
Best for: Cluster comparison
Behavior: Nodes arranged in circle
Use case: Seeing all clusters equally
3. Hierarchical
Best for: Parent-child relationships
Behavior: Tree-like structure
Use case: Understanding memory organization
Click cluster node:
- Highlights all connected memories
- Shows cluster name and member count
- Displays cluster statistics
Click entity node:
- Shows all memories containing entity
- Highlights related clusters
- Displays entity frequency
Click memory node:
- Opens memory detail card
- Shows all connected entities
- Highlights cluster membership
Drag nodes:
- Rearrange graph layout
- Fix node position
- Explore dense areas
1. Discover relationships:
Action: Zoom out to see full graph
Observation: "JWT" cluster connected to "API Security"
Insight: These topics are related
2. Explore cluster:
Action: Click "Authentication" cluster
View: All 12 memories in cluster
Insight: Common authentication patterns
3. Find entity usage:
Action: Click "FastAPI" entity node
View: 8 memories using FastAPI
Insight: Framework preference confirmed
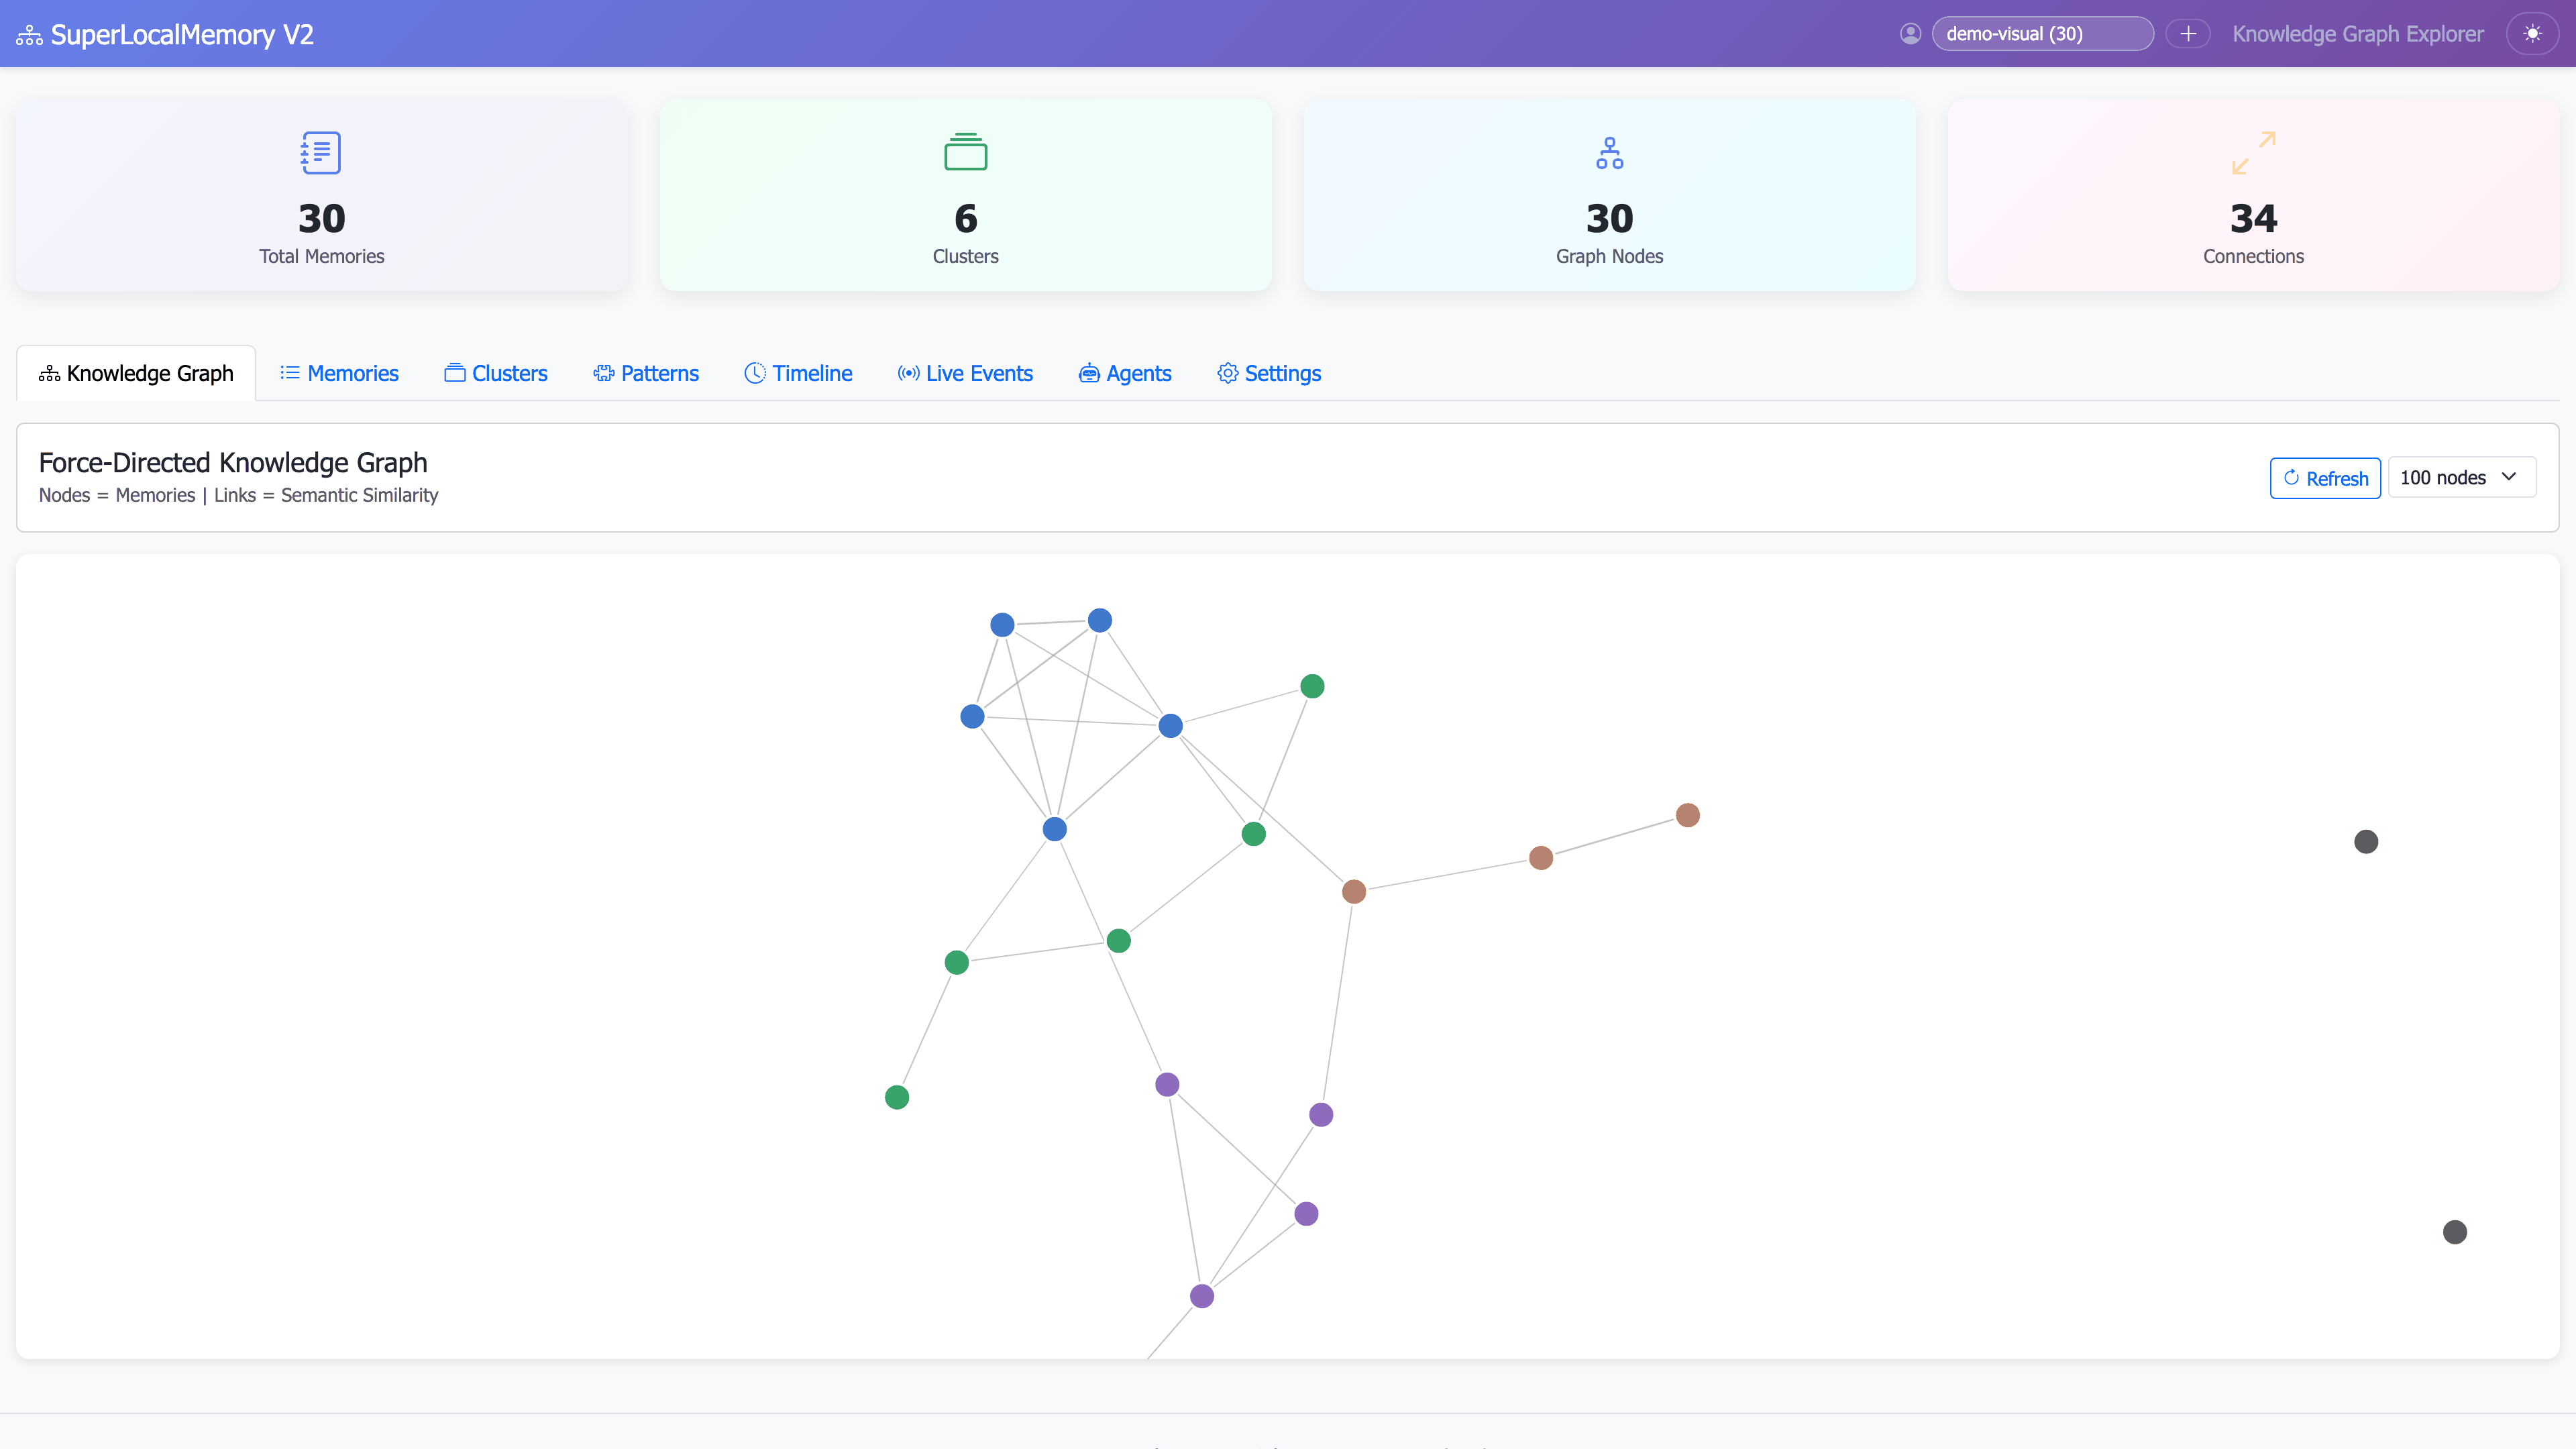
Interactive Graph Visualization:
Interactive graph with zoom, pan, and click-to-explore functionality
Knowledge Graph - Cluster View:
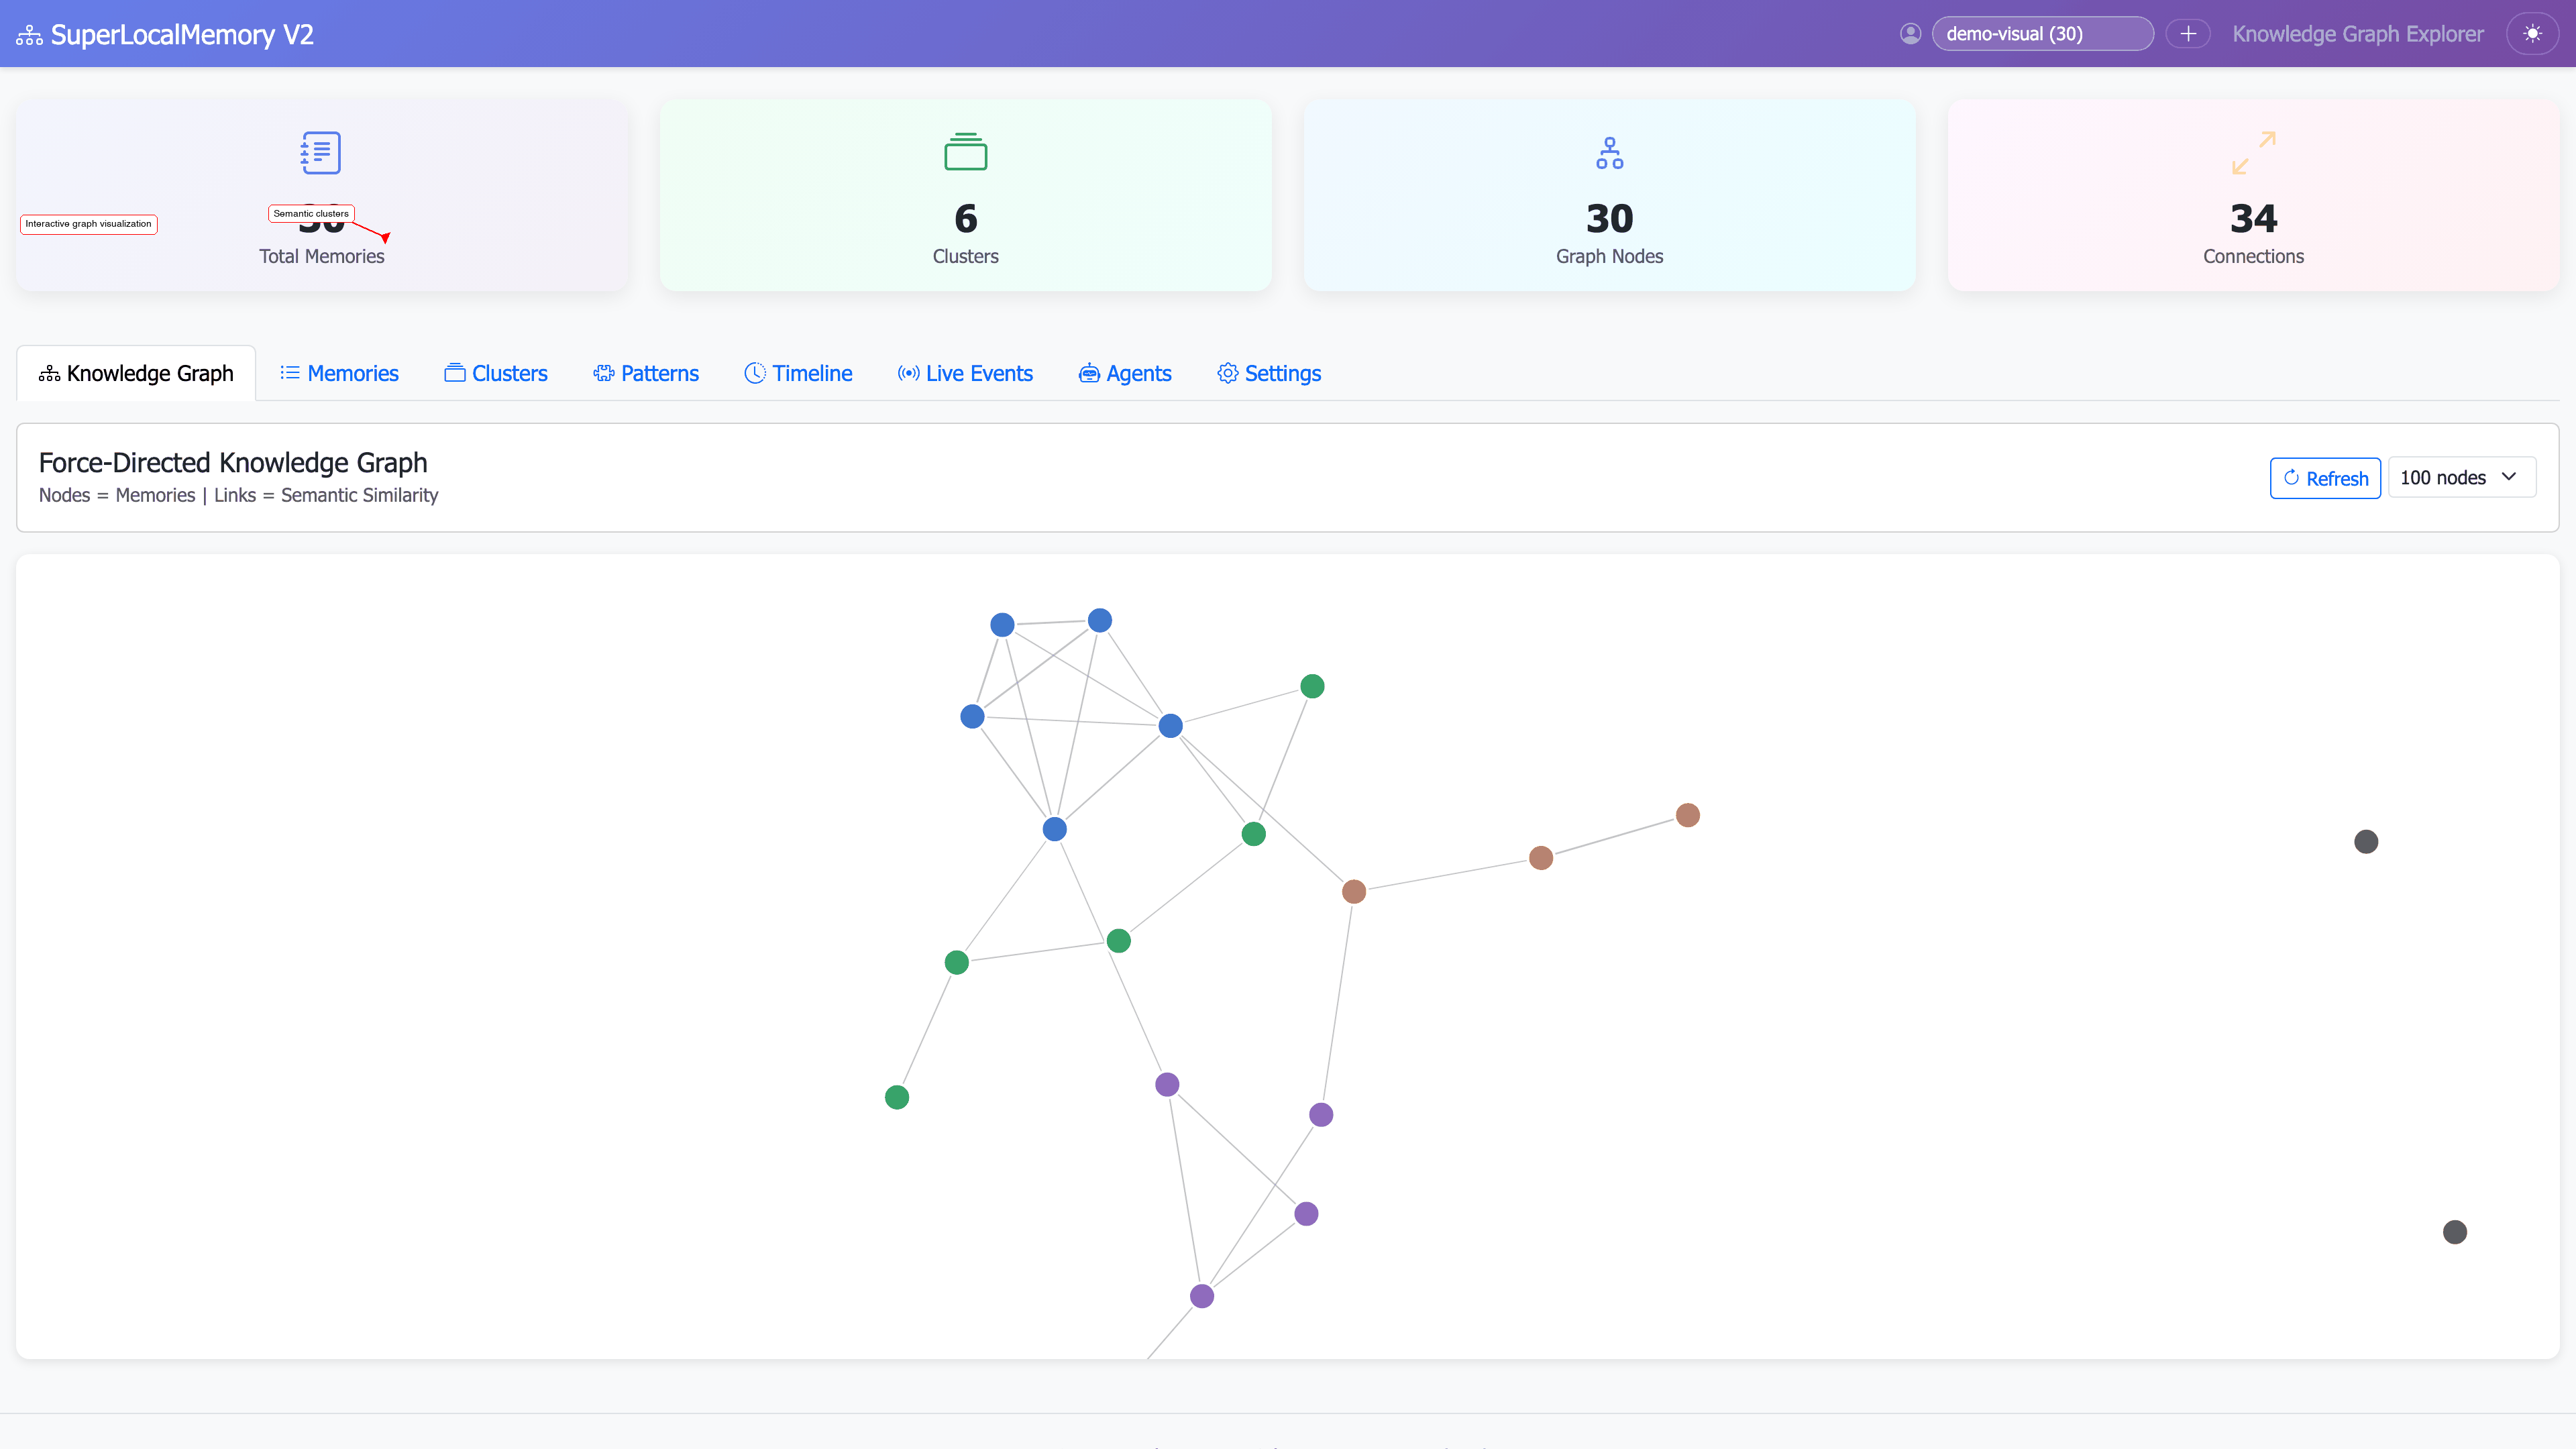
Full knowledge graph showing clusters, entities, and relationships with color coding
Cluster Details:
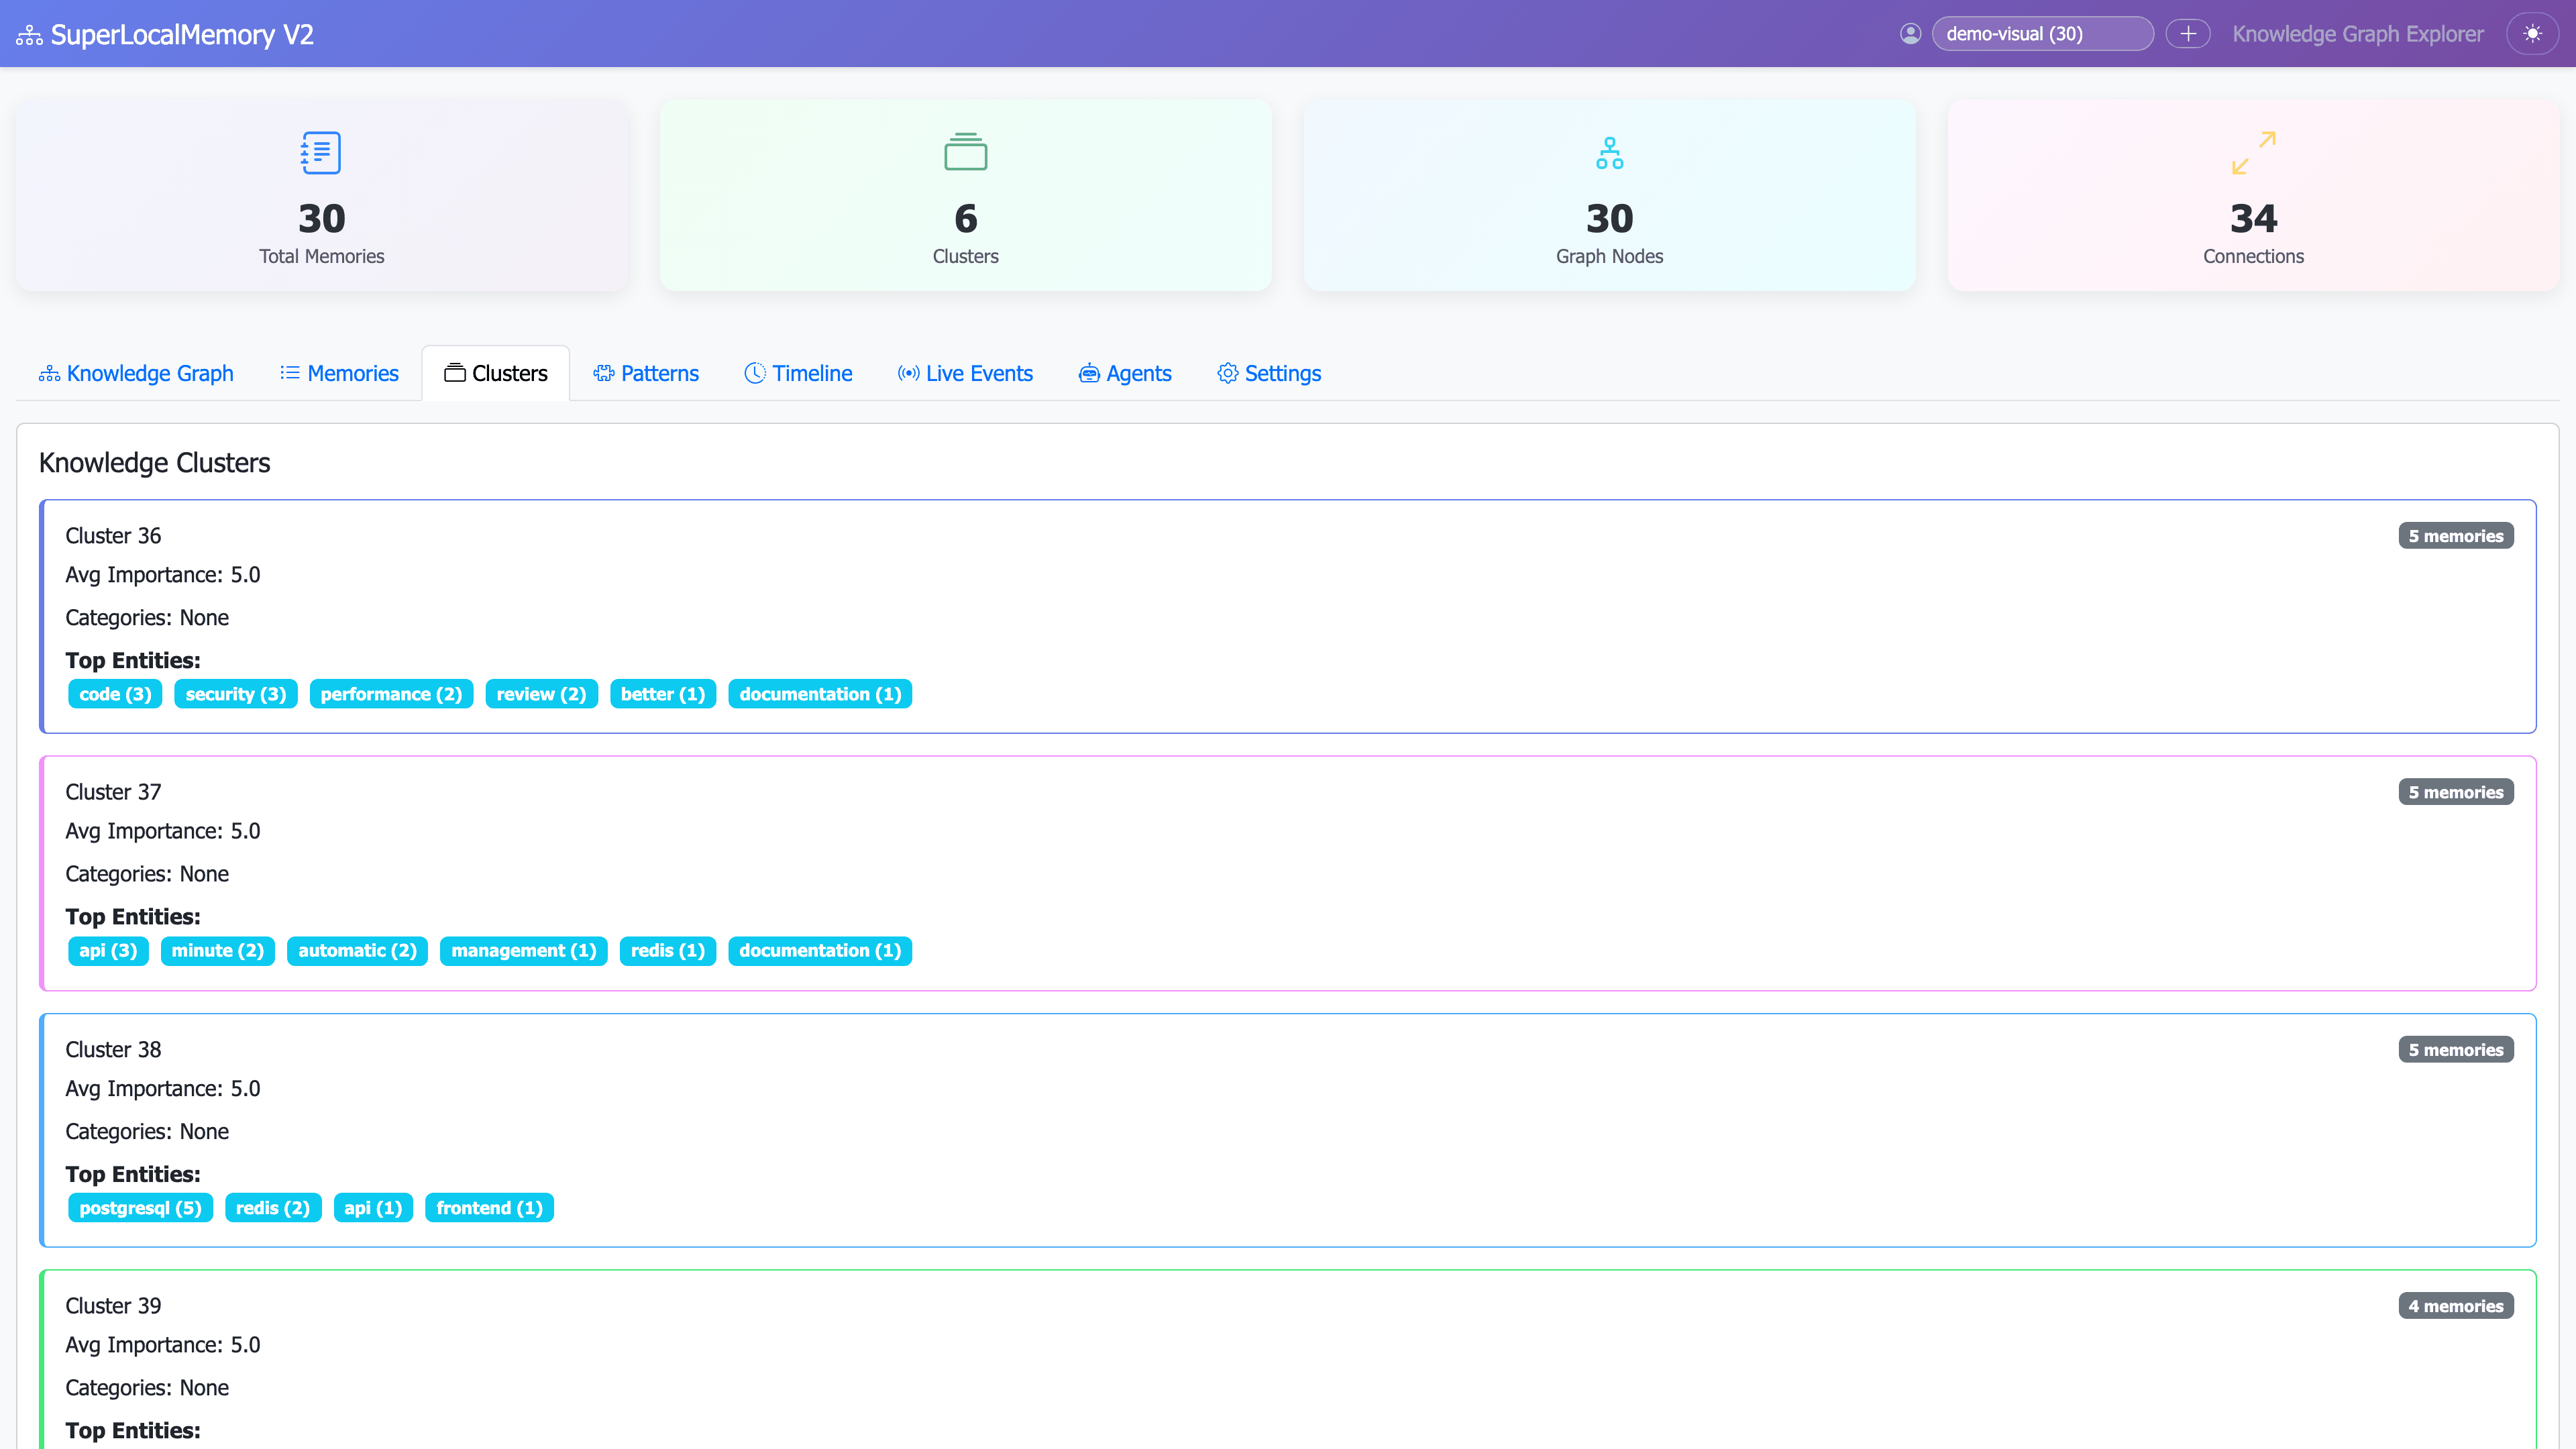
Detailed cluster view showing all members and connections
Real-time analytics showing memory trends, tag clouds, pattern insights, and usage statistics.
| Feature | Description |
|---|---|
| Memory trends | Memories added over time (line chart) |
| Tag cloud | Most used tags (word cloud) |
| Importance distribution | Pie chart of importance levels |
| Cluster sizes | Bar chart of cluster member counts |
| Pattern confidence | Top learned patterns with scores |
| Access heatmap | Most accessed memories |
| Search trends | Most common search queries |
| Growth metrics | Total memories, growth rate |
1. Memory Trends (Line Chart)
Shows: Memories added per day/week/month
Options: Toggle date range (7d, 30d, 90d, all)
Insight: When you're most productive
2. Tag Cloud (Word Cloud)
Shows: Most frequent tags (size = frequency)
Options: Color schemes, min frequency
Insight: Your main topics
3. Importance Distribution (Pie Chart)
Shows: Breakdown of importance levels 1-10
Options: Show percentages, counts
Insight: How you prioritize information
4. Cluster Sizes (Bar Chart)
Shows: Number of memories per cluster
Options: Sort by size/name, show top N
Insight: Largest knowledge areas
5. Pattern Confidence (Table)
Shows: Learned patterns with confidence scores
Options: Filter by confidence threshold
Insight: Your coding identity
6. Access Heatmap (Calendar Heatmap)
Shows: Memory access frequency over time
Options: Color schemes, date ranges
Insight: Which memories you reference most
1. Track productivity:
Widget: Memory Trends
Period: Last 30 days
Insight: "I add more memories on Mondays"
2. Identify focus areas:
Widget: Tag Cloud
View: All tags
Insight: "authentication, react, performance are my main topics"
3. Analyze patterns:
Widget: Pattern Confidence
Threshold: 60%
Insight: "I prefer React (73%), Jest (65%), REST (81%)"
Statistics Dashboard - Overview:
Full statistics dashboard with memory counts, cluster distribution, and key metrics
Pattern Learning Analytics:
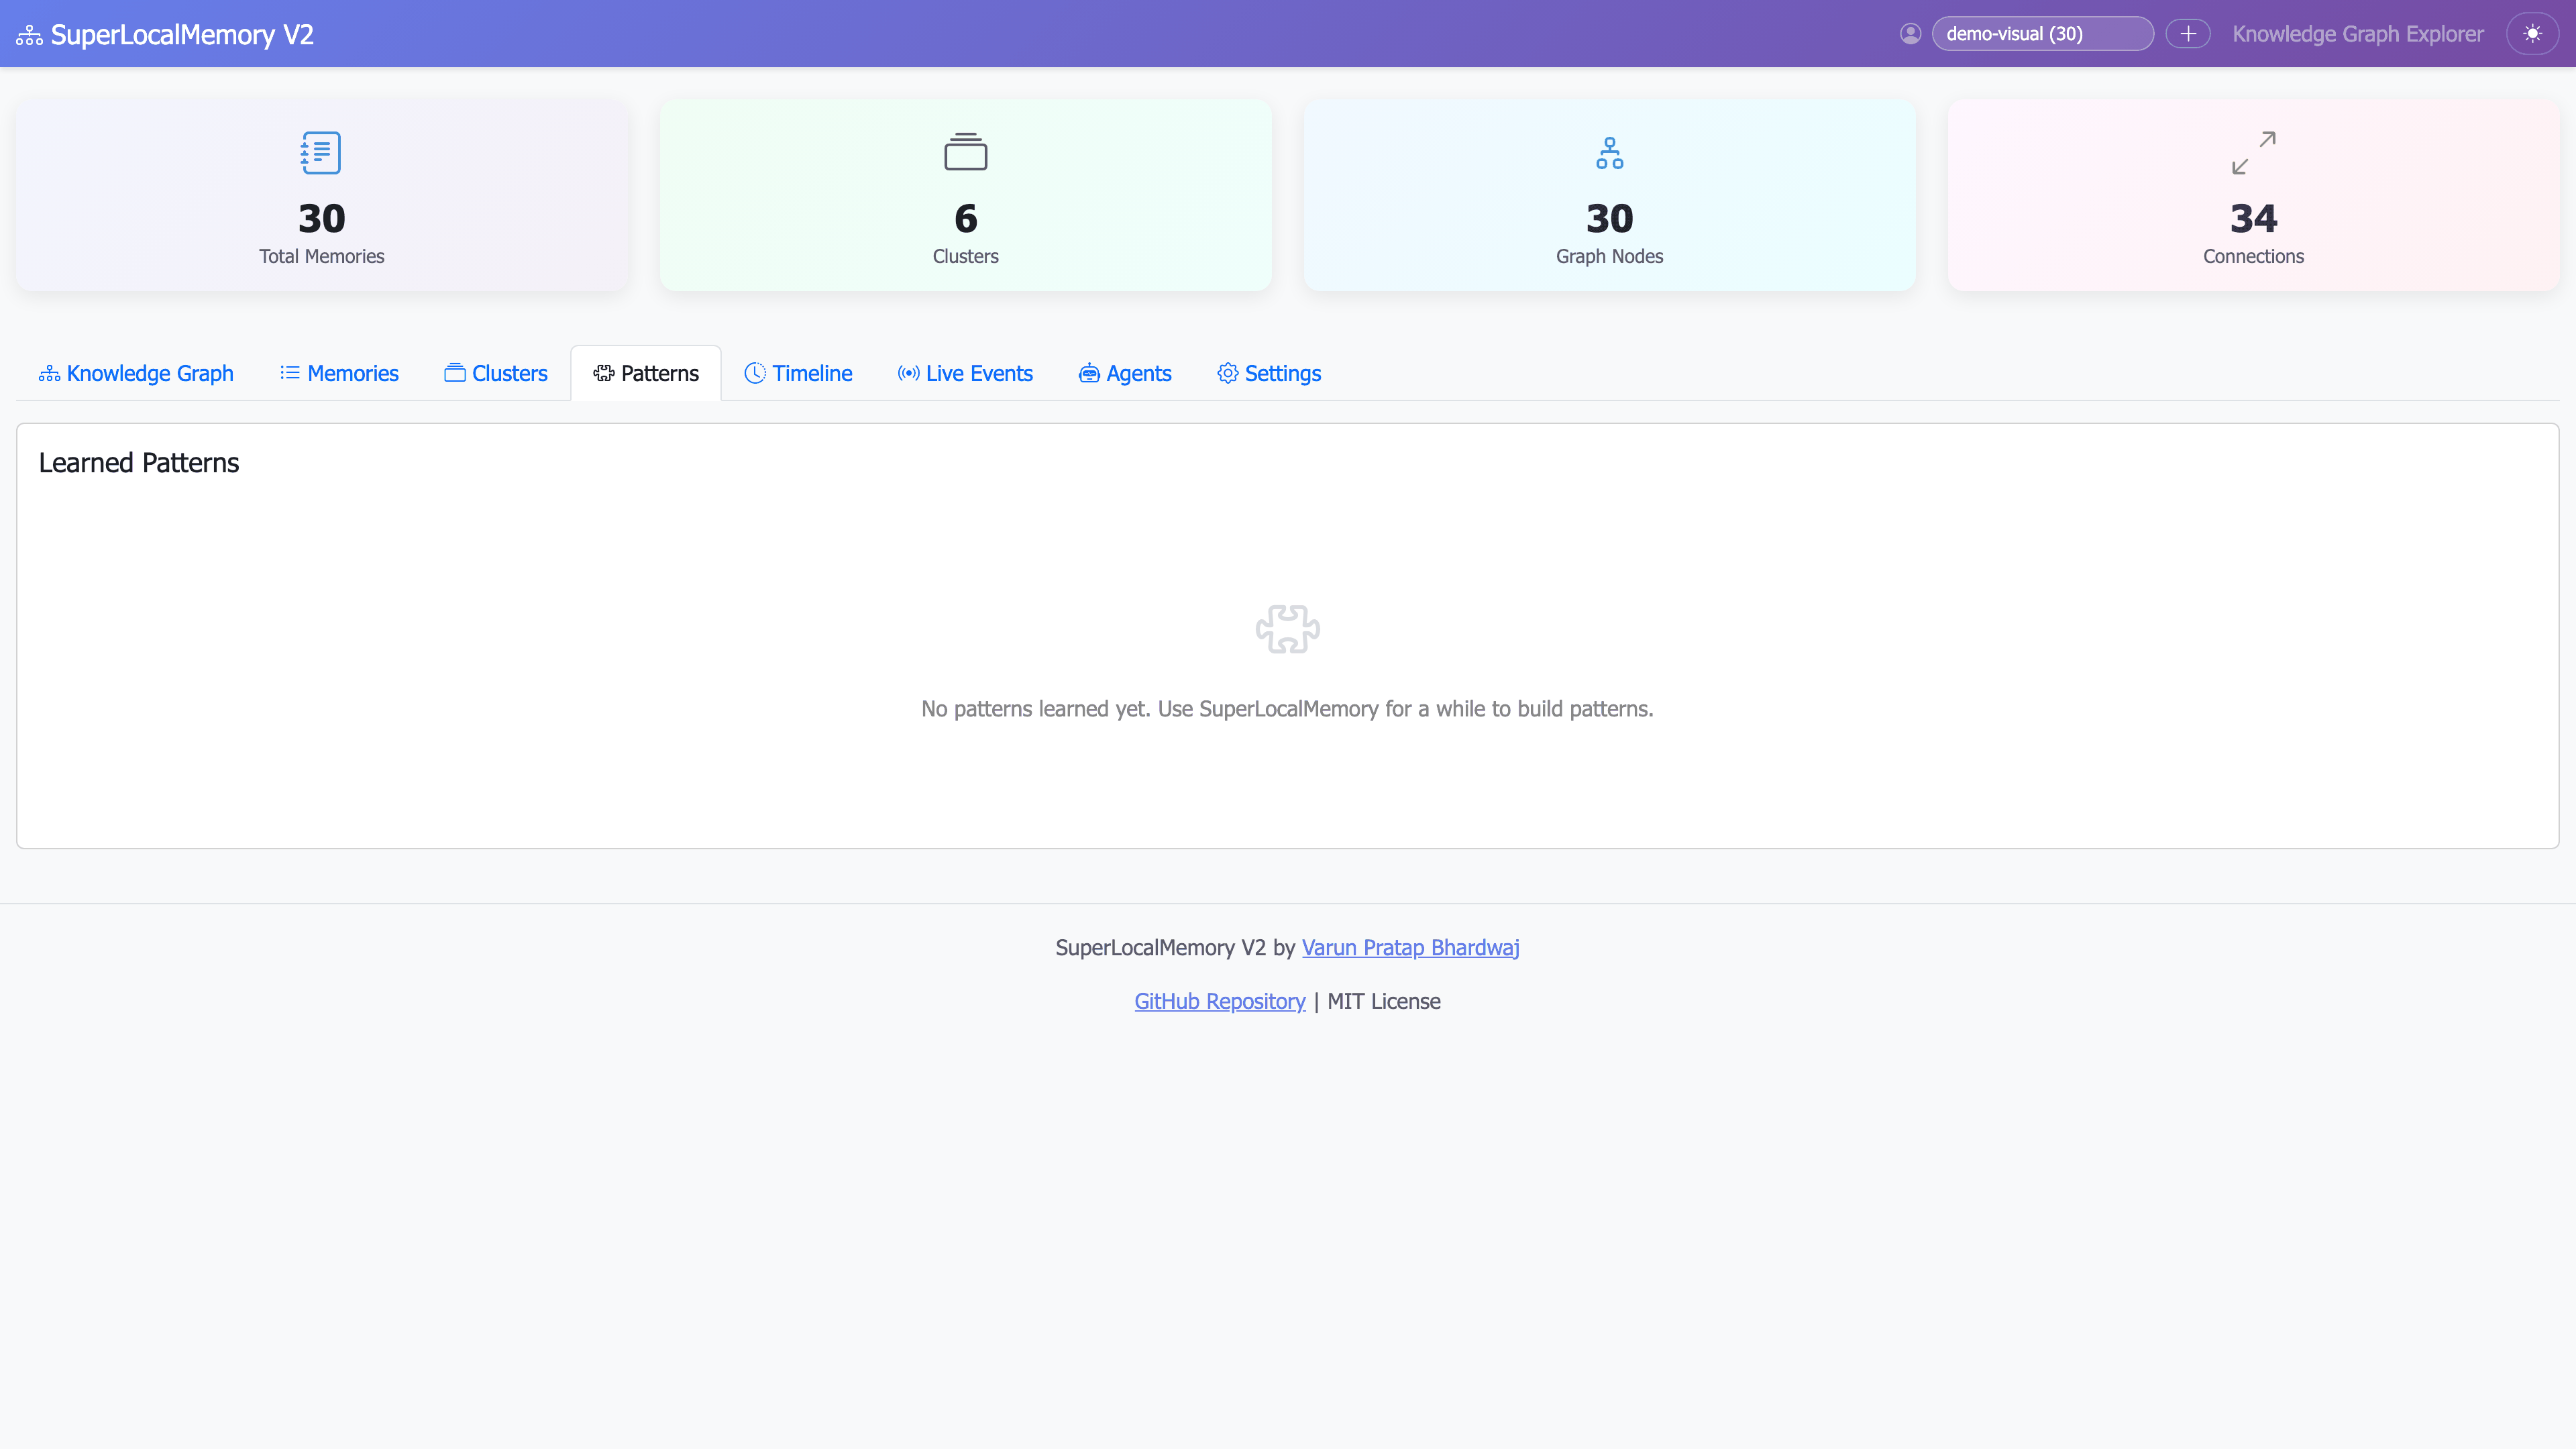
Learned patterns with confidence scores showing coding preferences and identity profiles
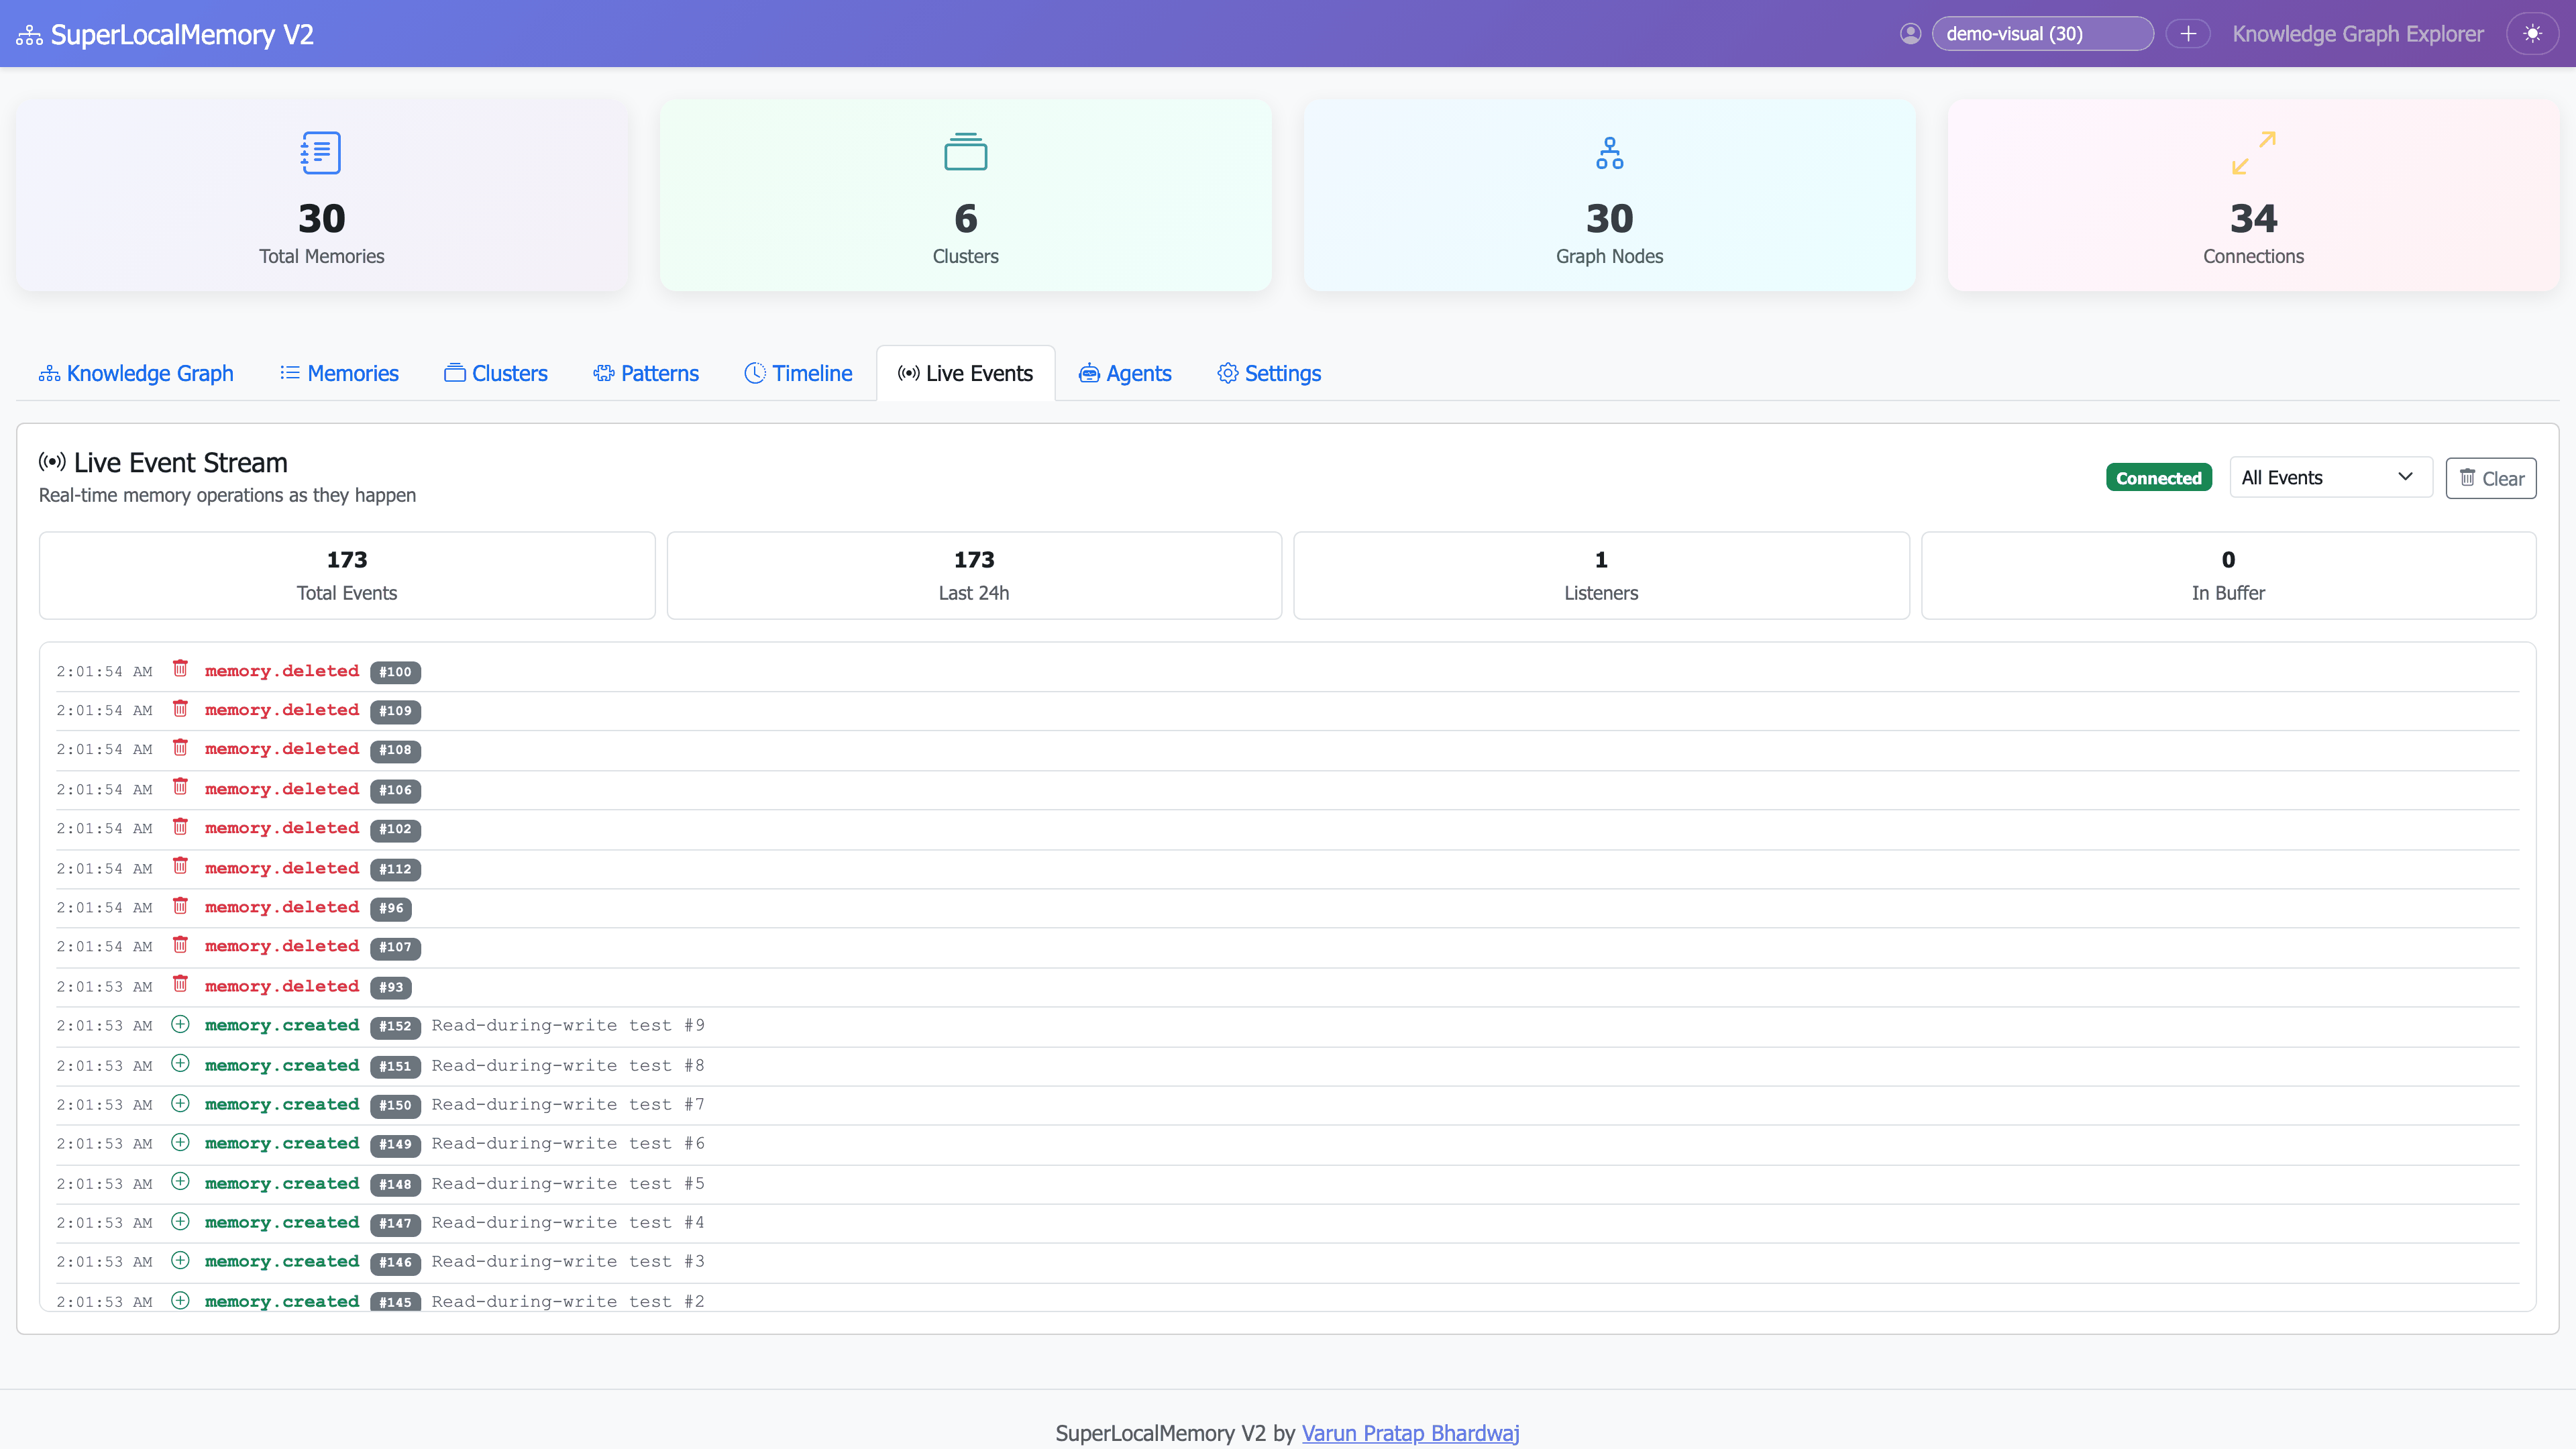
Live Events & Agent Activity:
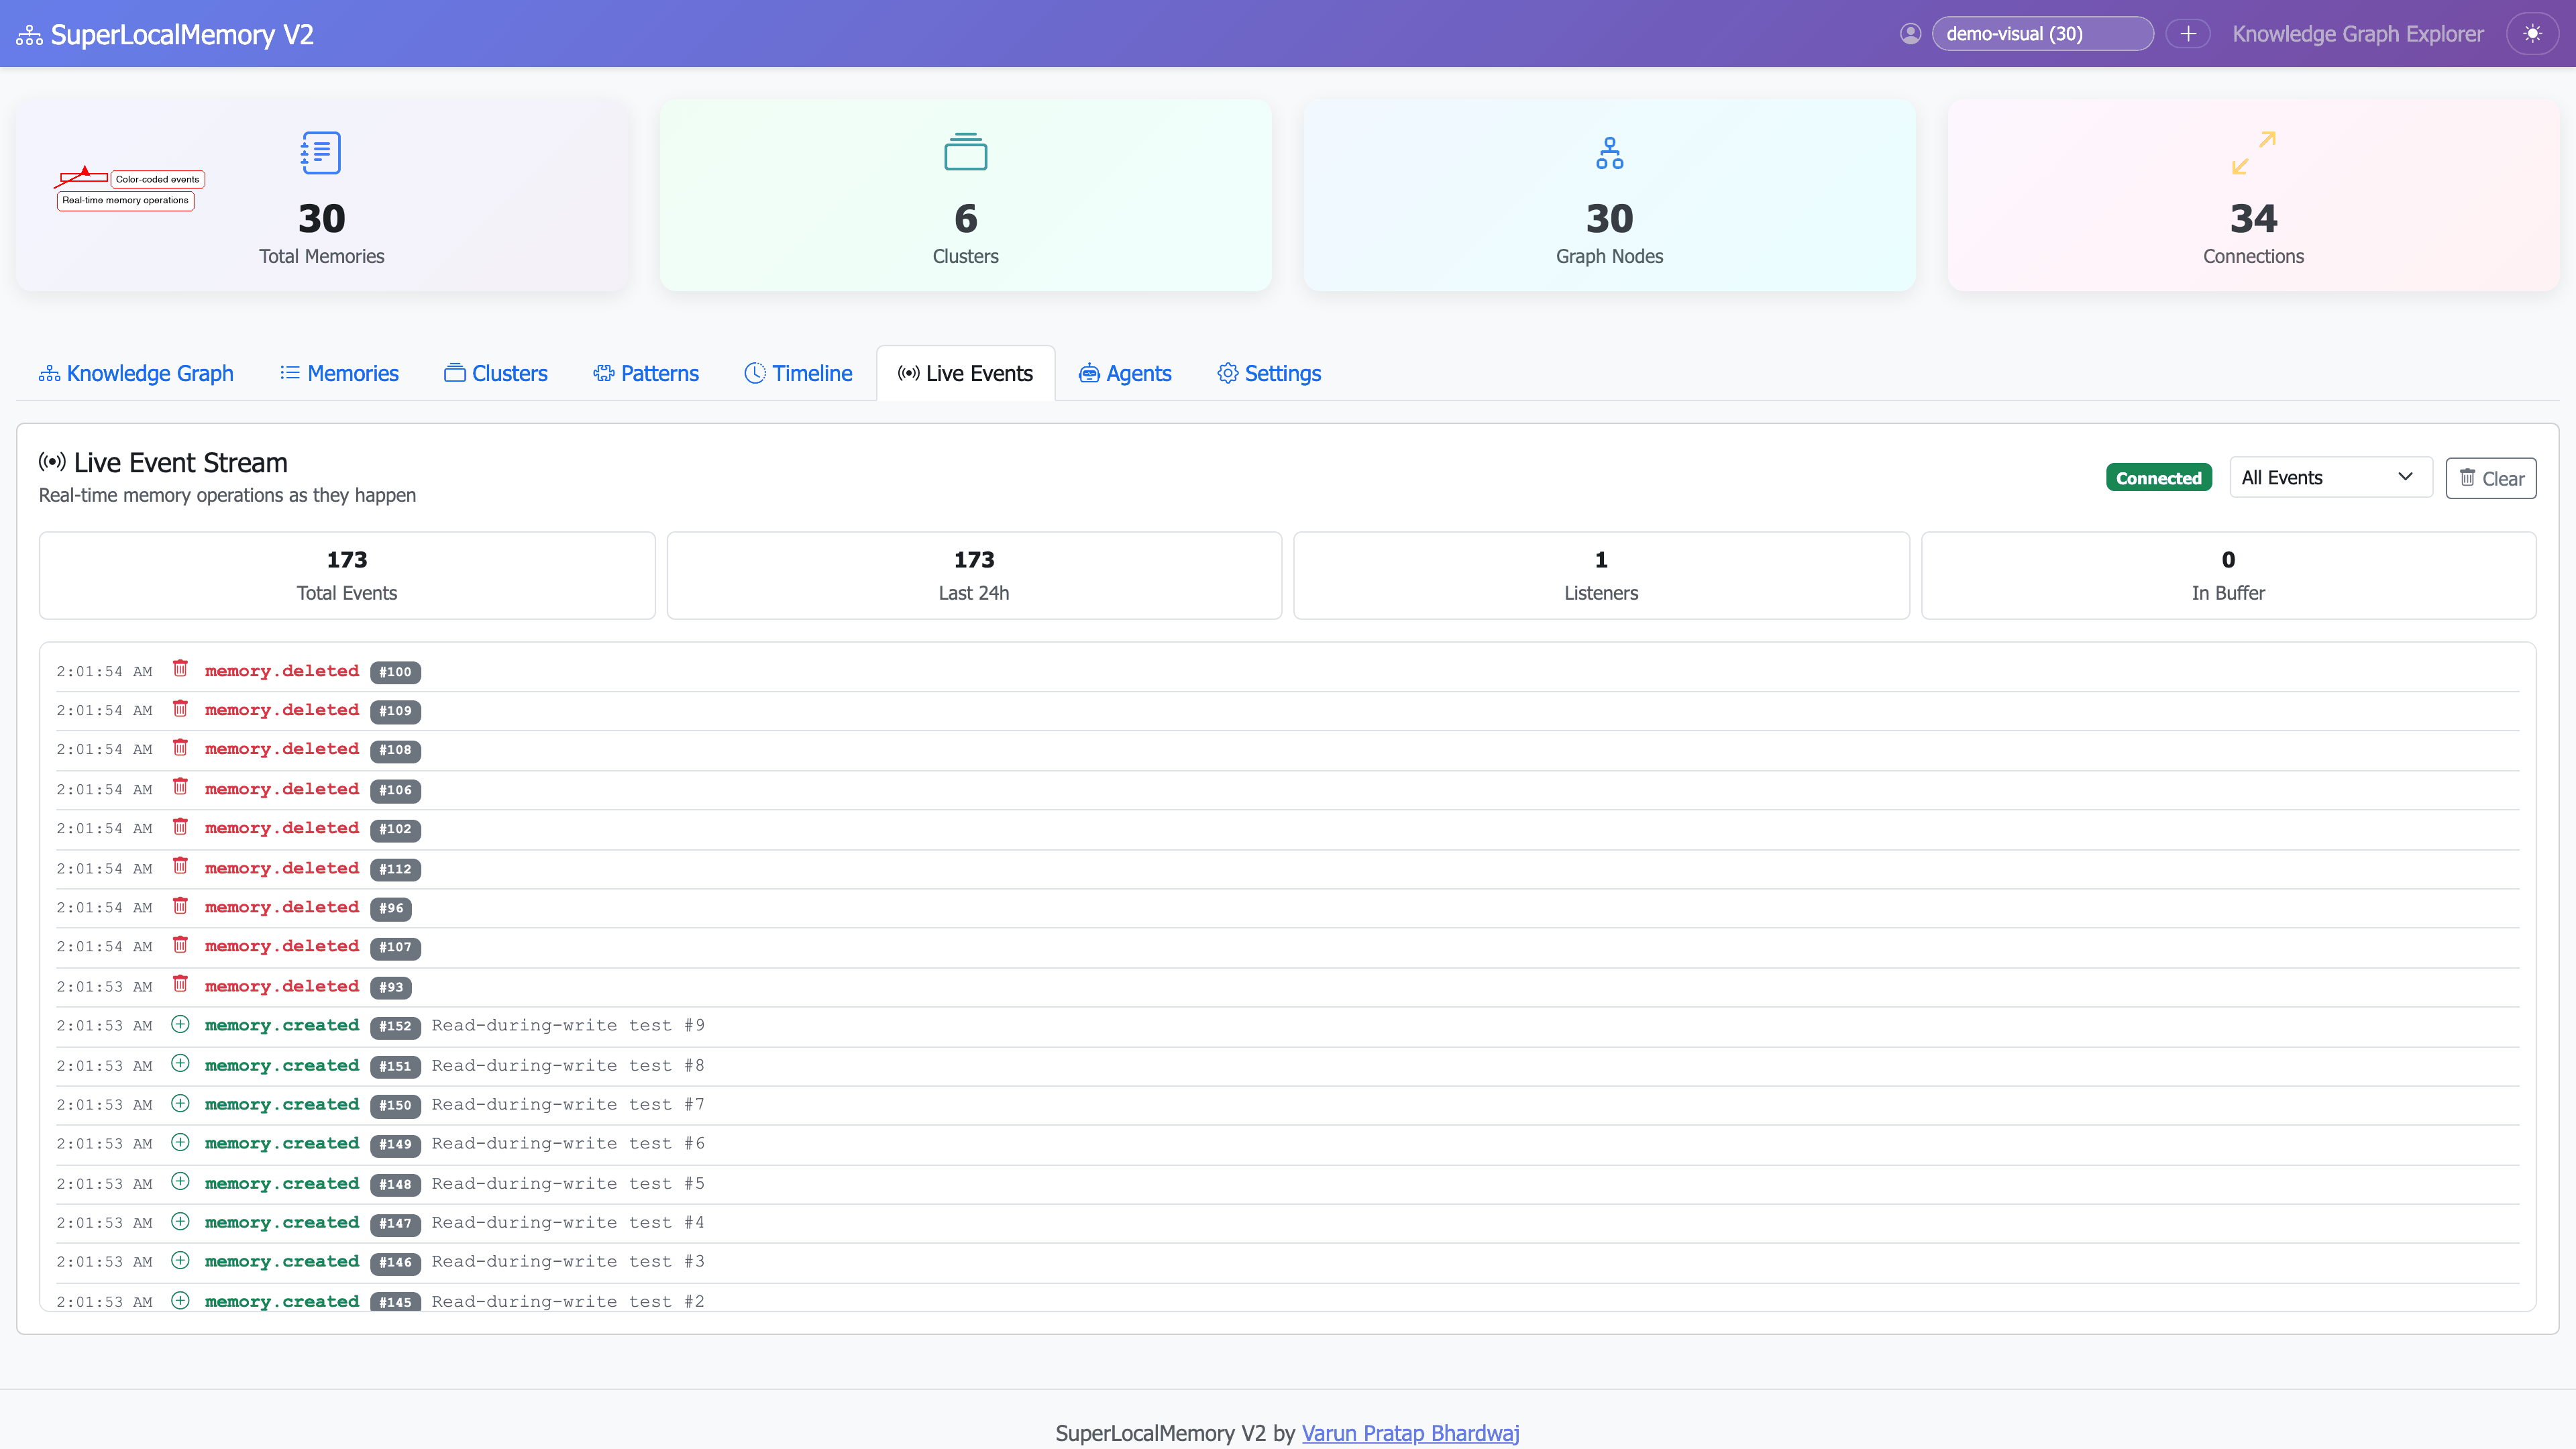
Real-time event stream showing memory operations and agent connections
Powerful filtering system for precise memory exploration across all dashboard views.
1. Date Range Filter
Options:
- Last 7 days
- Last 30 days
- Last 90 days
- Last year
- Custom range (date picker)

Use case: "Show only recent memories"
2. Tag Filter
Options:
- Multi-select dropdown
- Search within tags
- "Any of" or "All of" logic

Use case: "Show memories tagged 'authentication' AND 'security'"
3. Importance Filter
Options:
- Slider (1-10)
- Range selection (e.g., 7-10 for high priority)
- Exact value

Use case: "Show only critical memories (9-10)"
4. Cluster Filter
Options:
- Multi-select from available clusters
- Include/exclude specific clusters
- Unclustered only

Use case: "Show only 'Authentication' and 'API Design' clusters"
5. Project Filter
Options:
- Dropdown of all projects
- Multiple project selection
- Default project only

Use case: "Show memories from 'myapp' project"
6. Score Filter (Search only)
Options:
- Minimum score threshold (0-100%)
- Only perfect matches (90%+)
- Show all results

Use case: "Show only high-confidence matches (70%+)"
Example 1: Recent Critical Work
Filters:
- Date: Last 7 days
- Importance: 7-10
- Tags: work, deployment

Result: Critical work memories from this week
Example 2: Authentication Review
Filters:
- Cluster: Authentication & Security
- Date: Last 90 days
- Score: 60%+

Result: Recent auth-related memories with high relevance
Example 3: React Project Context
Filters:
- Tags: react, components
- Project: frontend-app
- Importance: 5-10

Result: Important React memories for specific project
Filters are saved across sessions:
- Dashboard remembers last used filters
- Per-view filter preferences
- Export/import filter presets
Eye-friendly dark theme for long dashboard sessions.
- Toggle switch in top-right corner
- Automatic OS theme detection (optional)
- High contrast colors for readability
- Optimized for extended use
- Preference saved across sessions
Light Mode:
- Background: White (#FFFFFF)
- Text: Dark gray (#333333)
- Accent: Blue (#1890FF)
Dark Mode:
- Background: Dark blue (#1E1E1E)
- Text: Light gray (#E0E0E0)
- Accent: Cyan (#00BCD4)
File: ~/.claude-memory/dashboard_config.json
{
  "port": 8000,
  "host": "127.0.0.1",
  "theme": "auto",
  "default_view": "timeline",
  "timeline": {
    "items_per_page": 50,
    "date_format": "YYYY-MM-DD HH:mm"
  },
  "search": {
    "default_strategy": "hybrid",
    "min_score": 0.5,
    "max_results": 100
  },
  "graph": {
    "layout": "force",
    "node_size_range": [10, 50],
    "edge_thickness_range": [1, 5]
  },
  "stats": {
    "refresh_interval": 60,
    "cache_enabled": true
  }
}Change port:
"port": 8080Default view:
"default_view": "search" // Options: timeline, search, graph, statsSearch strategy:
"default_strategy": "semantic" // Options: semantic, fts, graph, hybridGraph layout:
"layout": "circular" // Options: force, circular, hierarchical1. Enable caching:
"stats": {
  "cache_enabled": true,
  "cache_ttl": 300  // 5 minutes
}
2. Limit timeline items:
"timeline": {
  "items_per_page": 25  // Smaller pages load faster
}
3. Use date range filters:
Instead of: Loading all 5,000 memories
Use: Filter to last 30 days (500 memories)
Result: 5x faster load time
4. Simplify graph visualization:
"graph": {
  "max_nodes": 100,  // Limit visible nodes
  "min_edge_weight": 0.5  // Hide weak connections
}| Dataset Size | Timeline Load | Search Time | Graph Render |
|---|---|---|---|
| 100 memories | < 100ms | 35ms | < 200ms |
| 500 memories | < 300ms | 45ms | < 500ms |
| 1,000 memories | < 500ms | 55ms | < 1s |
| 5,000 memories | < 2s | 85ms | < 3s |
Dashboard is responsive and works on mobile devices.
- Touch gestures for graph zoom/pan
- Swipe navigation between views
- Optimized layouts for small screens
- Reduced animation for performance
- Graph visualization simplified (fewer nodes)
- Some advanced filters hidden behind menu
- Statistics widgets stacked vertically
Error: ModuleNotFoundError: No module named 'dash'
Solution:
pip install dash plotly pandas networkxError: OSError: [Errno 48] Address already in use
Solution:
# Use different port
python ~/.claude-memory/ui_server.py --port 8051

# Or kill existing process
lsof -ti:8765 | xargs killIssue: Graph takes > 5 seconds to load
Solution:
# 1. Reduce max nodes in config
"max_nodes": 100

# 2. Use simpler layout
"layout": "circular"

# 3. Rebuild graph with higher similarity threshold
python ~/.claude-memory/graph_engine.py build --min-similarity 0.5Issue: Dashboard shows "0 memories"
Solution:
# 1. Check database
sqlite3 ~/.claude-memory/memory.db "SELECT COUNT(*) FROM memories;"

# 2. Check profile
python ~/.claude-memory/ui_server.py --profile default

# 3. Reinitialize database (if needed)
slm statusUse case: Starting a new session, need context
Steps:
- Open timeline view
- Filter: Last 7 days
- Scan memories chronologically
- Export as text for AI assistant
2. Discover Hidden Patterns
Use case: Want to understand your knowledge base
Steps:
- Open graph visualization
- Look for dense cluster areas
- Click clusters to explore
- Note surprising connections
Use case: Review project evolution
Steps:
- Open statistics dashboard
- View memory trends (last 90 days)
- Filter by project tag
- Analyze growth and focus areas
Use case: "We decided something about auth..."
Steps:
- Open search explorer
- Search: "authentication decision"
- Strategy: Hybrid
- Sort by date
- Find the decision from 2 months ago
Use case: What did I work on this week?
Steps:
- Timeline view
- Filter: Last 7 days
- Filter: Importance 5+
- Export list
- Use in standup meeting
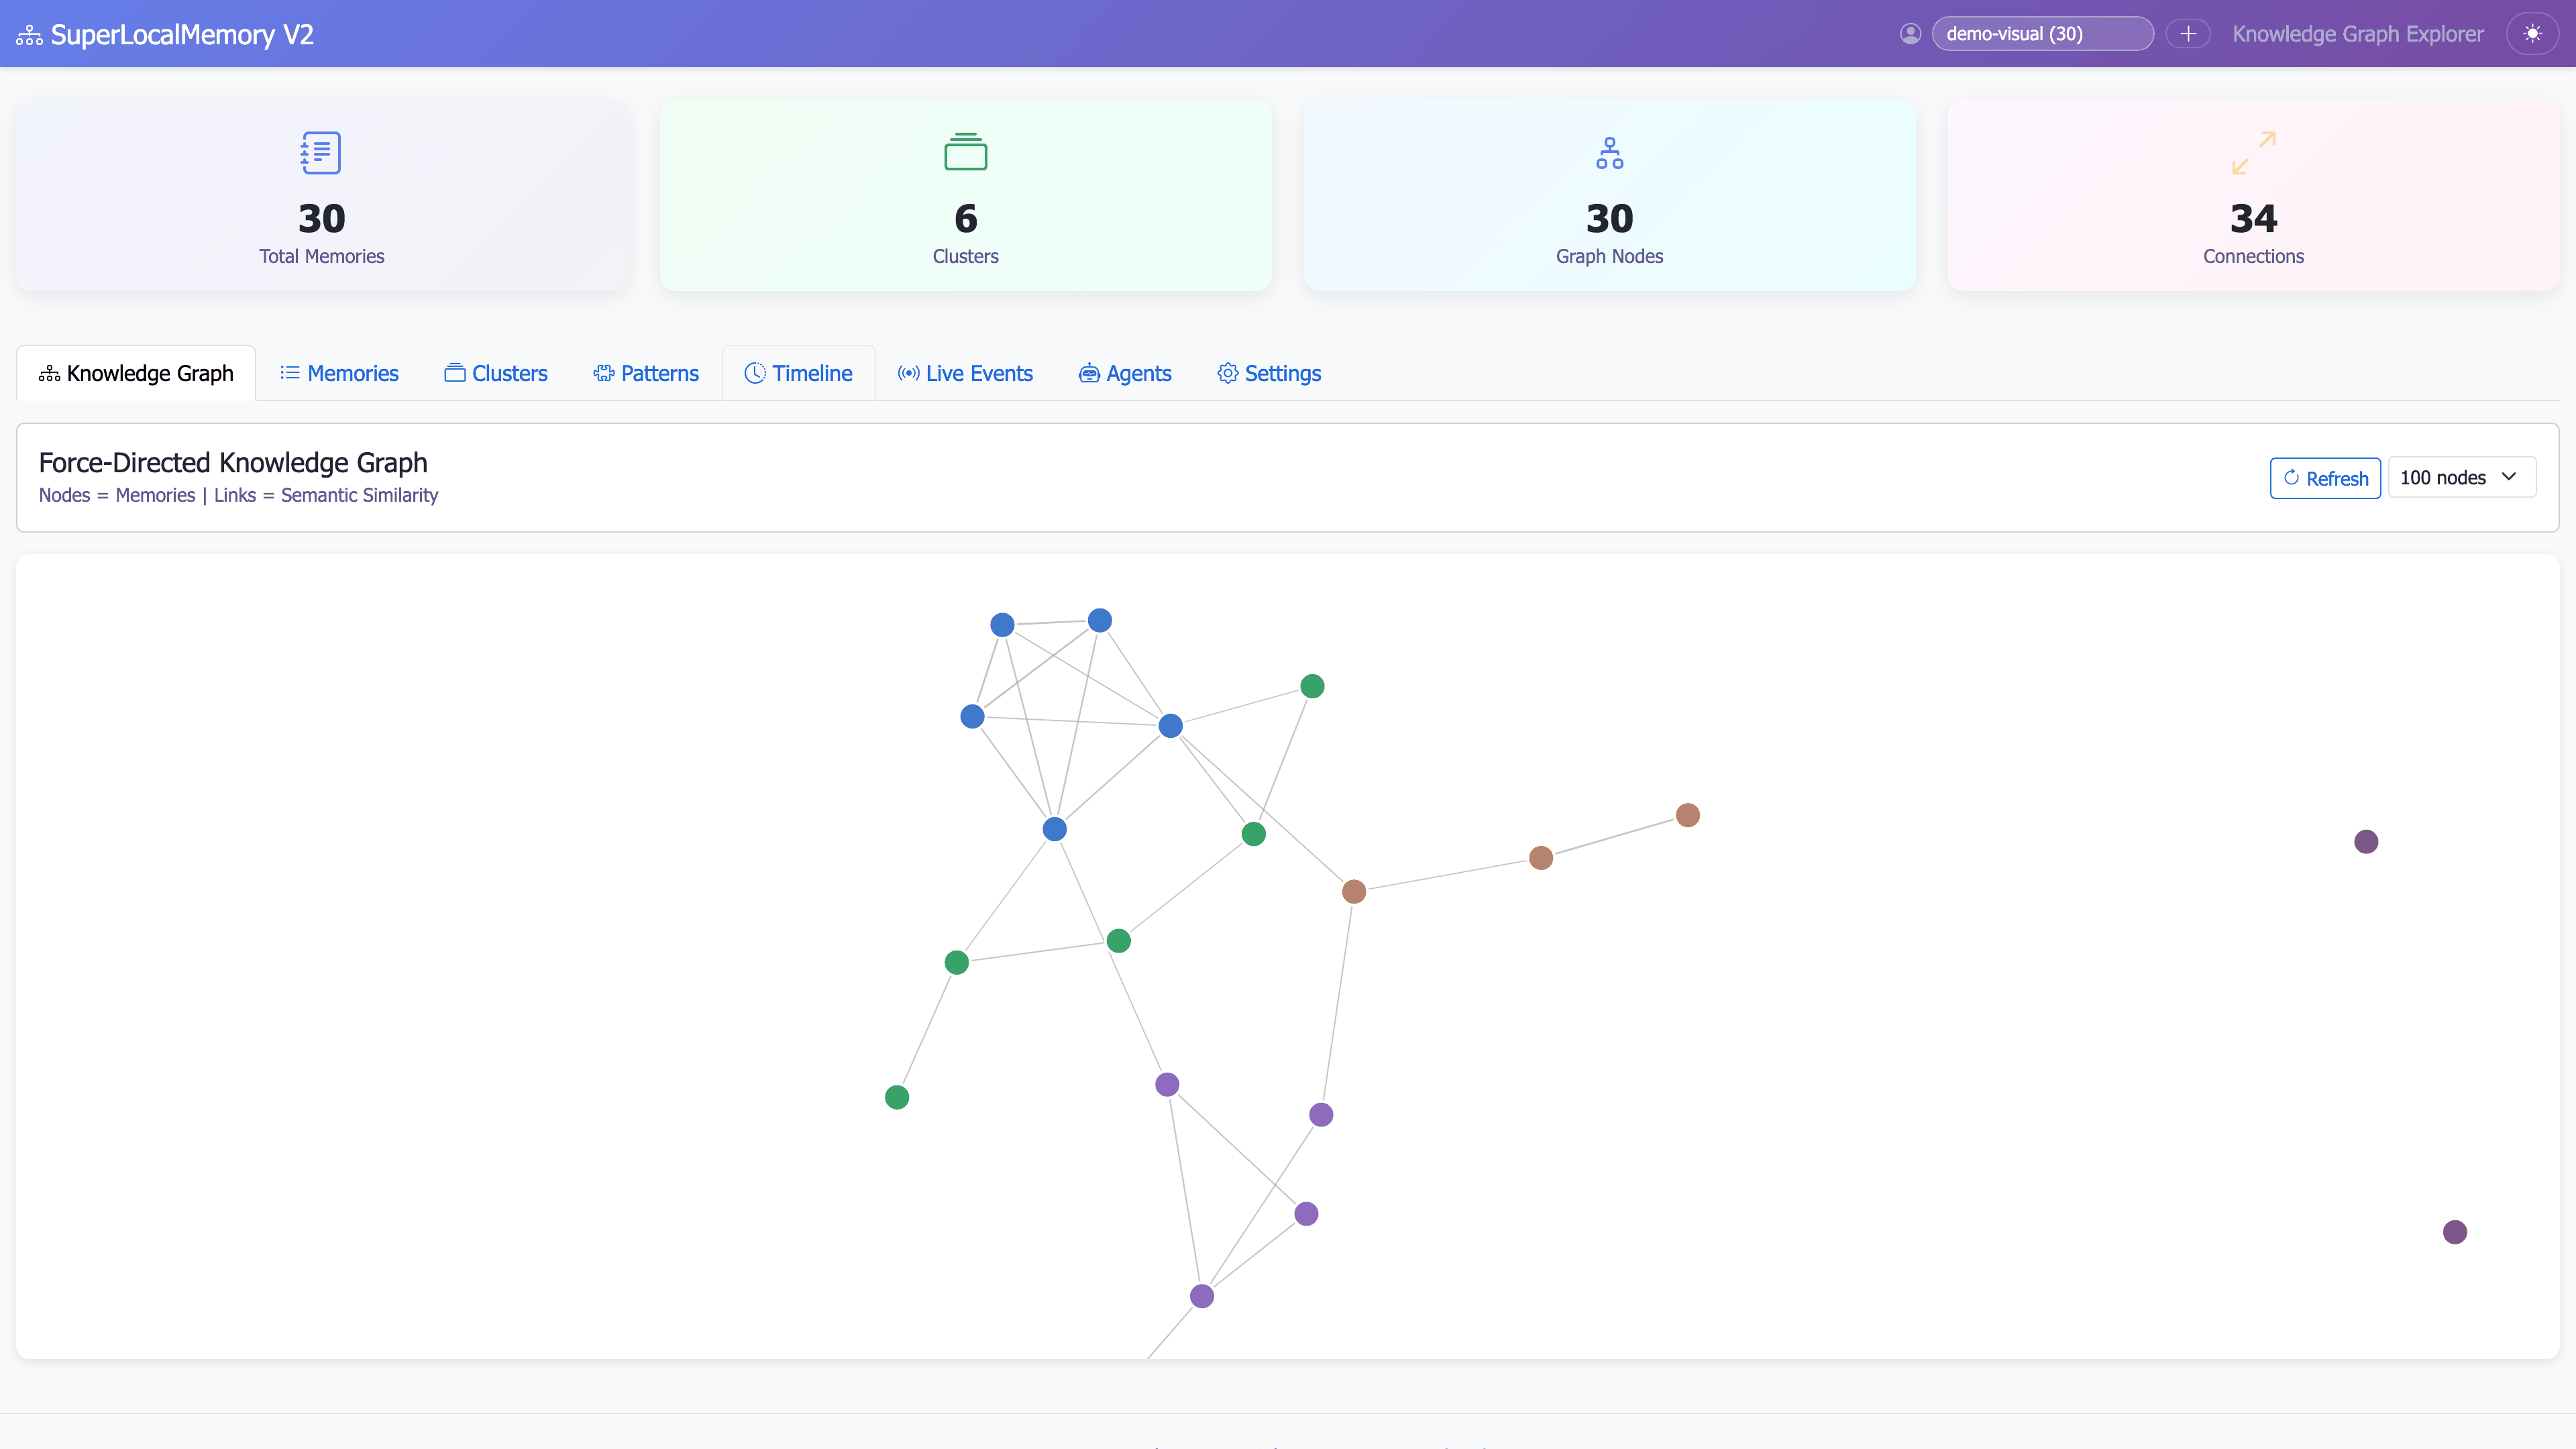
Overview Dashboard (Light Mode):
Overview Dashboard (Dark Mode):
Memory Timeline:
Filtered Memories:
Memory Cards (Light Mode):

Memory Cards (Dark Mode):

Graph Visualization:

Cluster Analysis:
Pattern Learning:
Live Events (Light Mode):
Live Events (Dark Mode):

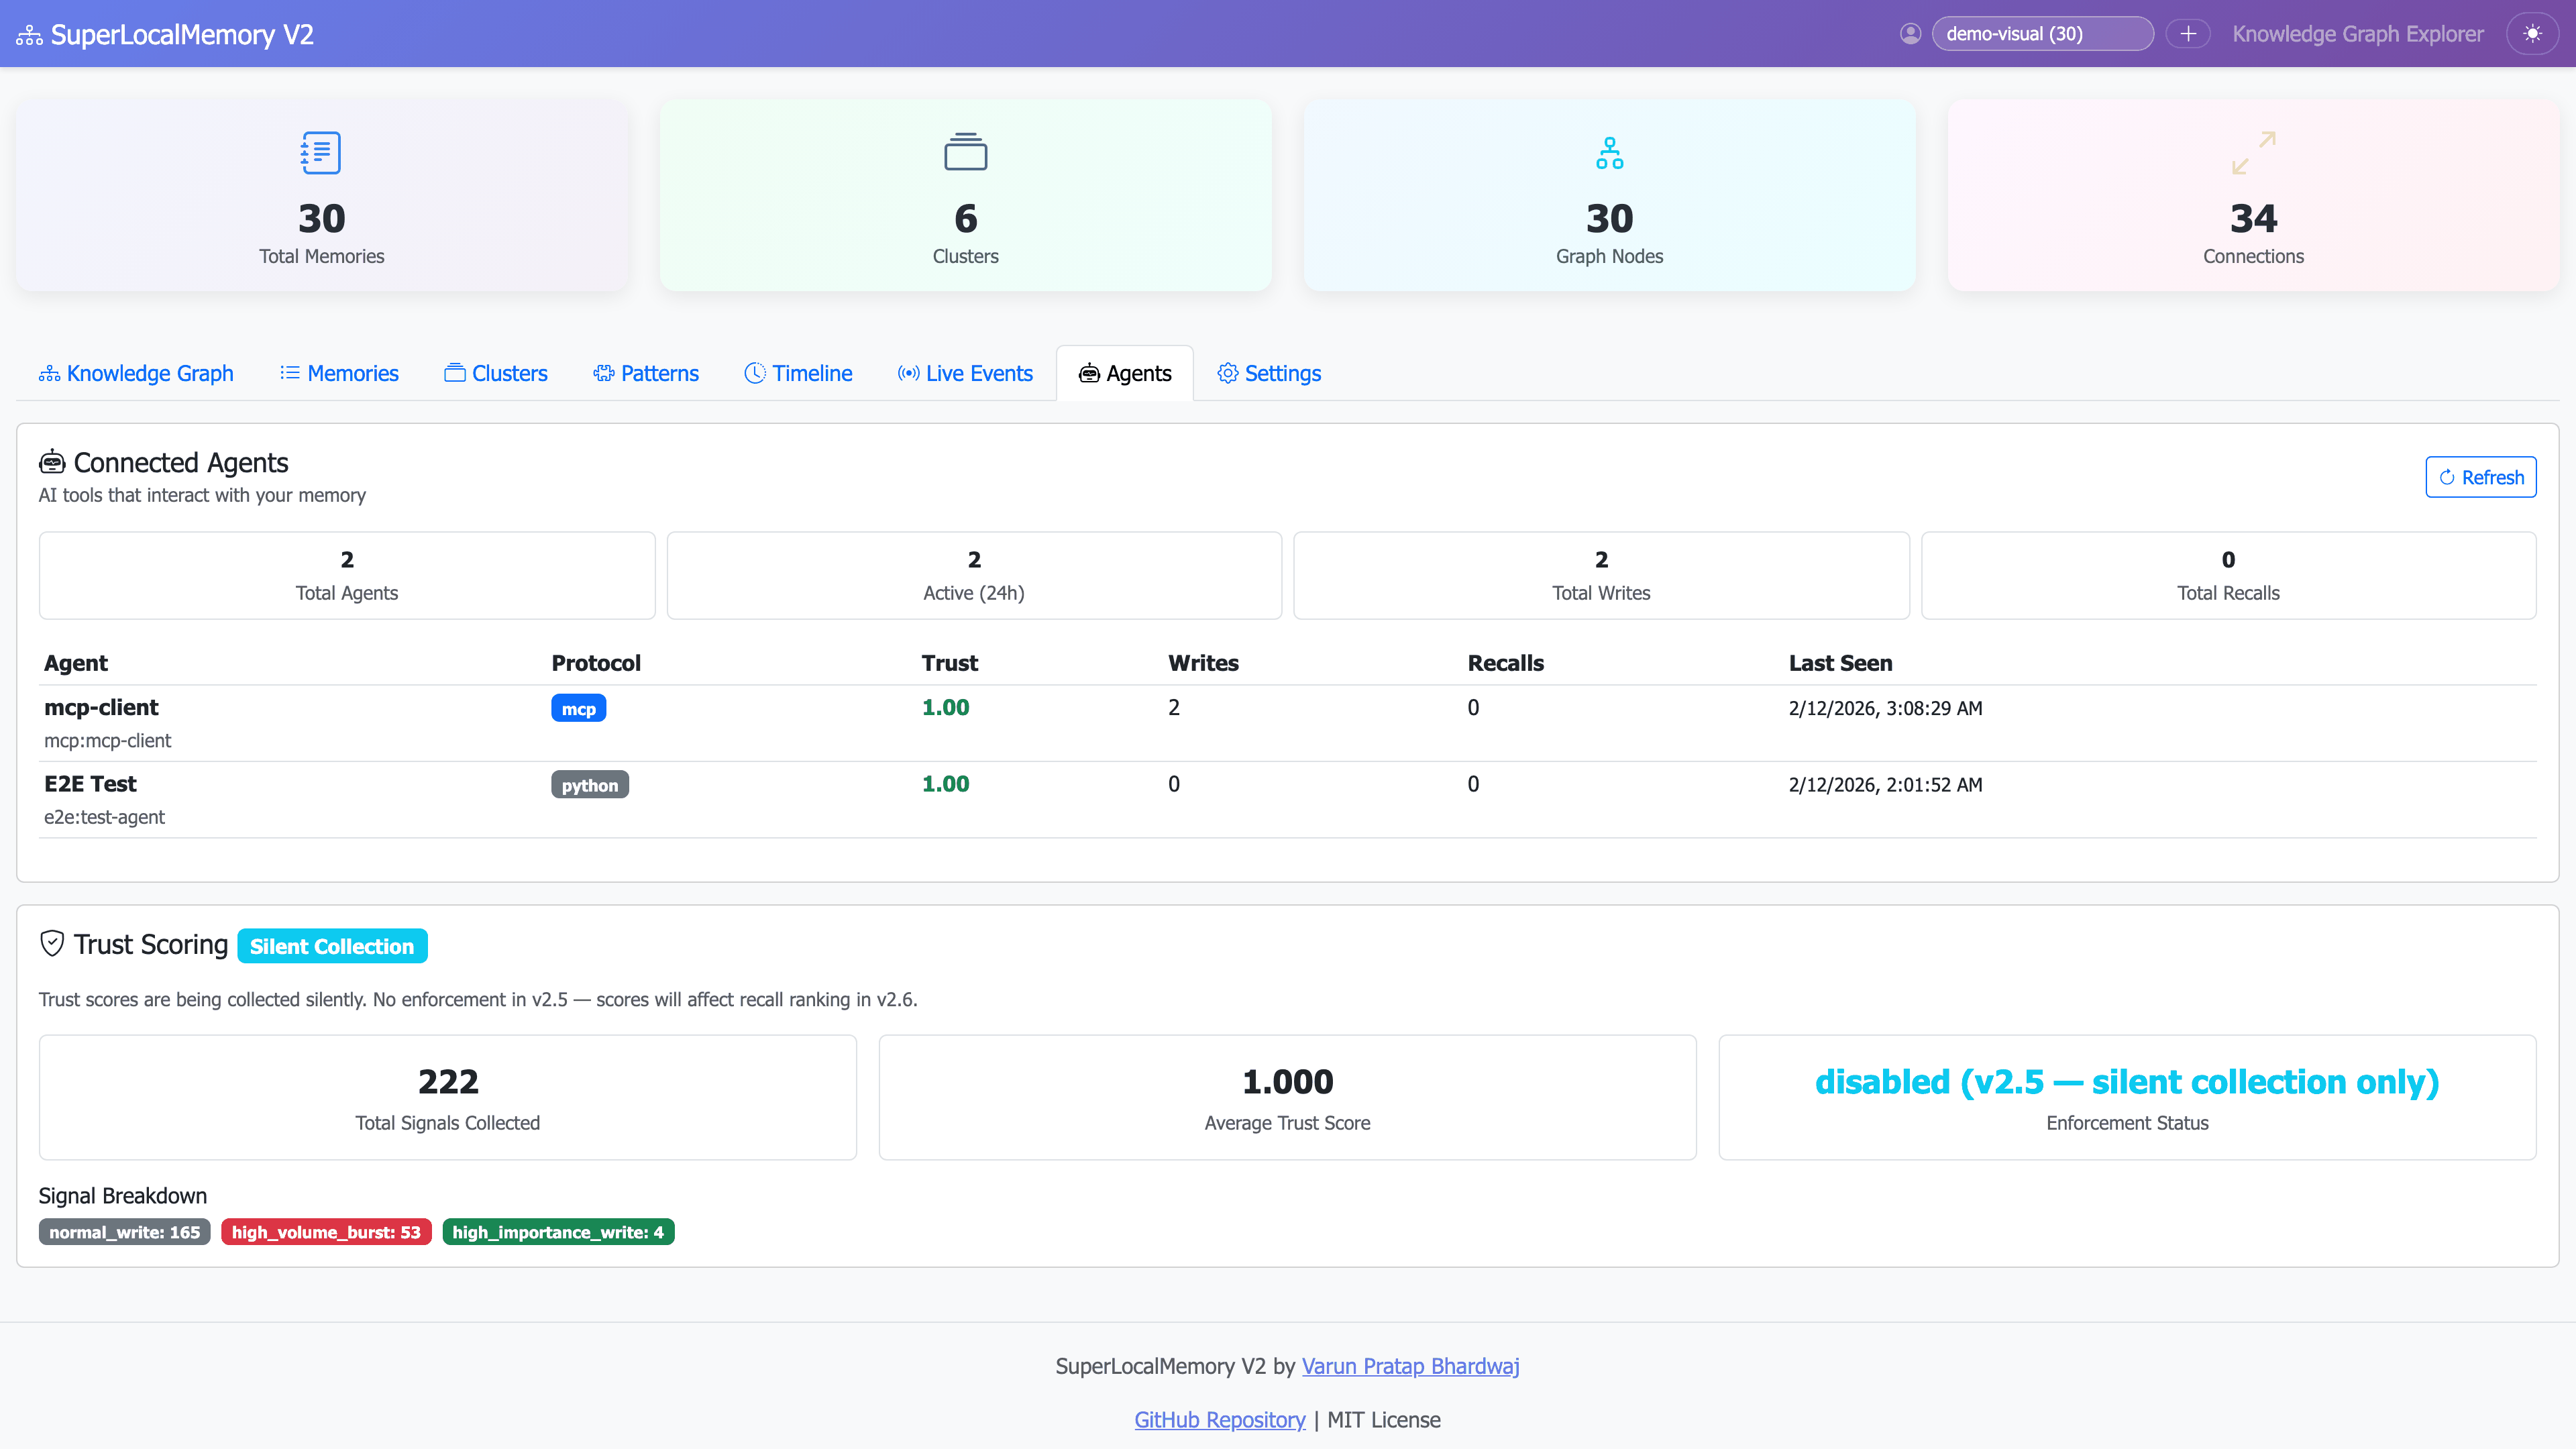
Agent Connections:
Overview - Annotated:
Memory Cards - Annotated:
Graph Visualization - Annotated:
Live Events - Annotated:
Agents Tab - Annotated:

Dashboard Tab Navigation:
Real-time Search:
Graph Interaction:
Event Stream:
| Shortcut | Action |
|---|---|
Ctrl+1 |
Timeline view |
Ctrl+2 |
Search explorer |
Ctrl+3 |
Graph visualization |
Ctrl+4 |
Statistics dashboard |
Ctrl+F |
Focus search box |
Ctrl+D |
Toggle dark mode |
Ctrl+R |
Refresh current view |
Esc |
Close modal/overlay |
Dashboard and CLI share the same database - changes are reflected instantly.
Add memory via CLI:
slm remember "New memory" --tags dashboard
# Refresh dashboard → Memory appears immediately
Search via CLI, visualize in dashboard:
# 1. Search via CLI
slm recall "authentication"

# 2. Open same search in dashboard
# 3. See visual scores and graph contextDashboard export:
- Export search results as JSON
- Use JSON in custom scripts
- Feed to other tools
1. Daily Context Refresh
View: Timeline (last 7 days)
Goal: Remember what you worked on
Time: 2 minutes
2. Architecture Review
View: Graph visualization
Goal: Understand system relationships
Time: 5 minutes
3. Pattern Analysis
View: Statistics dashboard
Goal: Learn your preferences
Time: 3 minutes
1. Knowledge Sharing
View: Timeline (filtered by project)
Export: PDF/HTML
Share: With team members
2. Onboarding New Members
View: Graph visualization
Goal: Show project structure
Export: Screenshot
3. Sprint Planning
View: Search explorer
Query: "last sprint decisions"
Export: Decision list
Planned for future releases:
- ✅ Real-time collaborative viewing
- ✅ Custom dashboard layouts
- ✅ Advanced analytics (NLP insights)
- ✅ Export to various formats (PDF, Markdown, HTML)
- ✅ AI-powered memory suggestions
- ✅ Integration with external tools (Notion, Obsidian)
- ✅ Mobile native app (iOS/Android)
- ✅ 3D graph visualization
- ✅ Voice search and navigation
- Universal-Architecture - Learn about the architecture
- Installation - Setup guide including dashboard dependencies
- Quick-Start-Tutorial - Get started quickly
- Knowledge-Graph-Guide - Understand clustering
- CLI-Cheatsheet - Command line reference
The Visualization Dashboard transforms SuperLocalMemory from a command-line tool into a comprehensive visual knowledge management system. With timeline views, semantic search explorer, interactive graph visualization, and real-time analytics, you can:
- ✅ Explore memories visually instead of text-only search
- ✅ Discover hidden relationships via interactive graphs
- ✅ Track trends and patterns with real-time statistics
- ✅ Filter precisely with advanced multi-dimensional filters
- ✅ Work efficiently with keyboard shortcuts and dark mode
Launch in seconds:
python ~/.claude-memory/ui_server.py
# http://localhost:8765
100% local. 100% private. 100% visual.
Created by Varun Pratap Bhardwaj Solution Architect • SuperLocalMemory
GitHub • Report Issue • Wiki