Features Correlation Analysis
The Correlation Analysis view combines modem signal data, speedtest results, BNetzA measurements, and detected events on a single unified timeline. This is your primary tool for proving that speed problems are caused by signal degradation.
DOCSight pulls data from up to four sources and aligns them by timestamp:
| Source | Data shown | Requires |
|---|---|---|
| Modem | Health status, DS power, DS SNR, US power, uncorrectable errors | Always available |
| Speedtest | Download/upload speed, ping, jitter, packet loss | Speedtest Tracker |
| Events | Health changes, power shifts, SNR drops, modulation changes, error spikes | Always available |
| BNetzA | Official measurement results with pass/fail verdict | BNetzA upload |
For each speedtest result, DOCSight finds the closest modem snapshot within a 2-hour window and enriches it with the signal health at that moment. This creates direct evidence: "At 20:15, my download was 95 Mbit/s while DS SNR had dropped to 28 dB."
Select the time range using the dropdown at the top:
- Last 24 Hours (default) -- most detailed view
- Last 48 Hours -- covers two full daily cycles
- Last 7 Days -- weekly patterns (e.g., evening congestion)
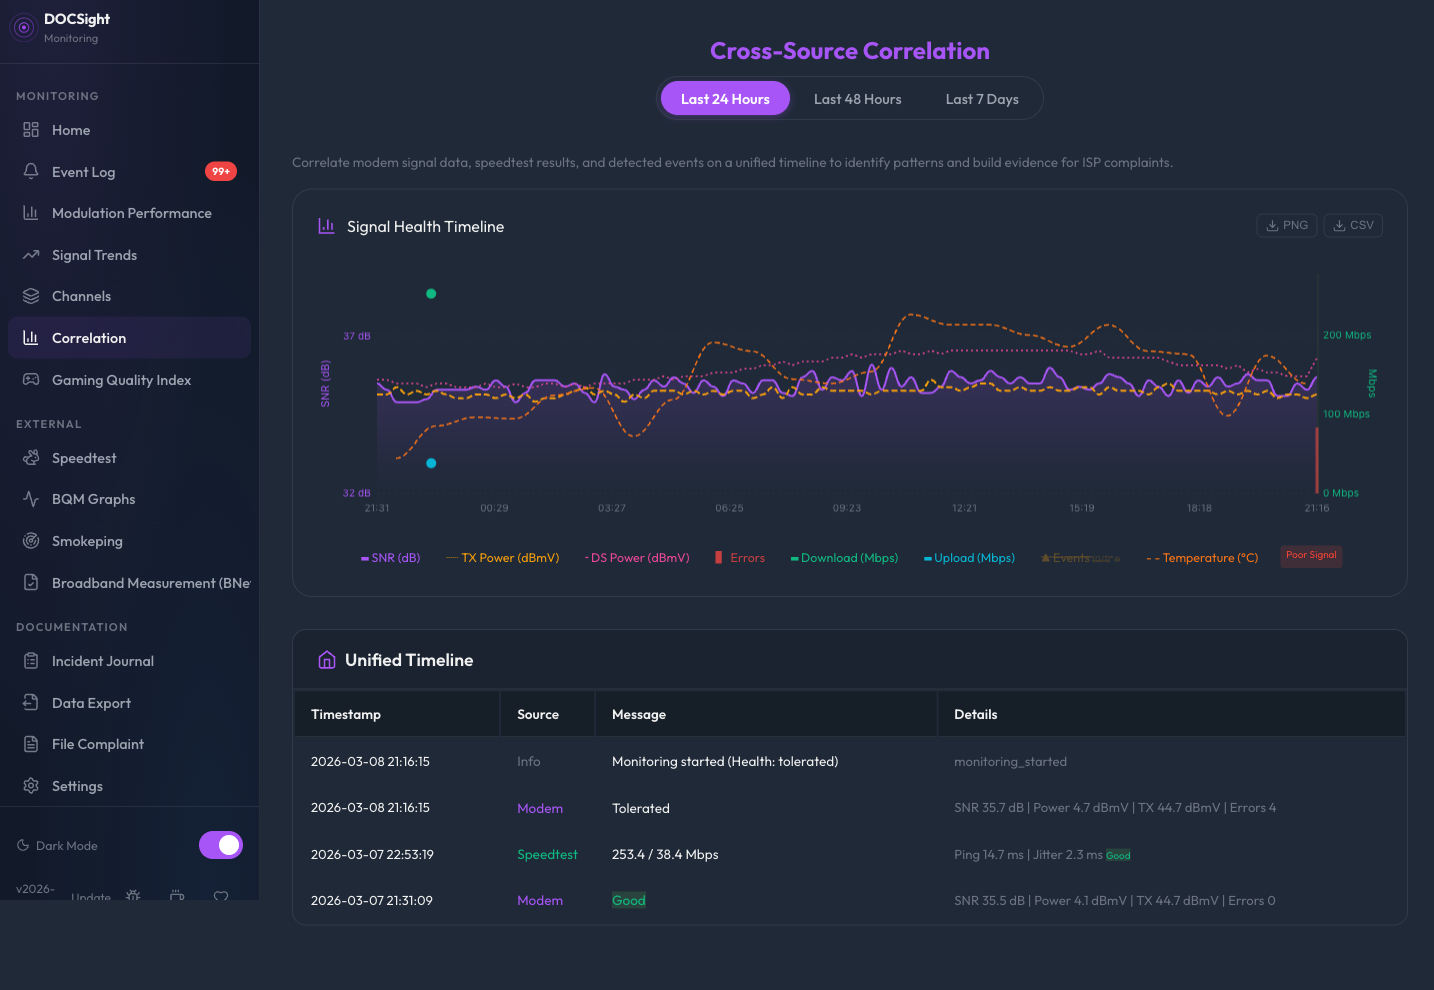
The main chart shows signal health over time with color-coded zones:
- Green zones: Signal within good thresholds
- Red zones: Signal degraded (power, SNR, or errors outside acceptable range)
Speedtest results are plotted as points on the timeline. When a speed drop falls inside a red zone, you have visual proof of correlation.
Below the chart, a detailed timeline lists all data points from all sources in chronological order:
- Modem entries: Health status badge, DS SNR, power levels, error counts
- Speedtest entries: Download/upload speed, ping, jitter, plus the signal health at the time of the test
- Event entries: Severity badge, type, and message
- BNetzA entries: Official measurement results
Click the export button to download the correlation data as a CSV file for further analysis in Excel, Google Sheets, or as an attachment to an ISP complaint.
Evening congestion: Speed drops consistently between 18:00 and 23:00, but signal stays green. This suggests ISP-side capacity issues, not a cable problem. A BNetzA measurement campaign during these hours strengthens your case.
Correlated signal + speed drops: Speed drops that coincide with SNR drops or power shifts point to a physical cable problem (loose connector, water ingress, faulty amplifier). The Event Log will show the exact threshold crossings.
Isolated speed drops: Speed issues without any signal changes may indicate ISP-side routing problems or throttling. The LLM Export can help analyze whether the pattern matches known throttling behavior.