Features Event Log
The Event Log automatically detects and records significant changes in your connection. No configuration needed. Events are stored permanently in the SQLite database and persist across restarts.
| Event | Trigger | Severity |
|---|---|---|
| Health Change | Overall status transitions (good/tolerated/marginal/critical) | Warning (degradation), Critical (to critical), Info (recovery) |
| Power Shift | DS or US power changes by more than 2.0 dBmV between polls | Warning |
| SNR Drop | SNR crosses the warning threshold for its modulation (e.g., 33 dB for 256QAM) | Warning (below warning), Critical (below critical) |
| Error Spike | Uncorrectable errors increase by more than 1,000 between polls | Warning |
| Modulation Change | QAM modulation upgrade or downgrade on any channel | Info (upgrade), Warning (small downgrade), Critical (3+ level drop) |
| Channel Change | DS or US channel count increases or decreases | Info |
| Monitoring Started | First poll after DOCSight starts | Info |
The modulation watchdog uses this QAM hierarchy to judge severity:
QPSK/4QAM < 8QAM < 16QAM < 64QAM < 256QAM < 1024QAM < 4096QAM
A drop from 256QAM to 64QAM (2 levels) is a warning. A drop from 256QAM to 16QAM (3+ levels) is critical. Upgrades are always informational.
The health assessment combines multiple factors. Any of these alone can push health to "critical":
- DS power outside critical range for the channel's modulation
- SNR below critical threshold
- US power outside critical range
- Total uncorrectable errors above 10,000
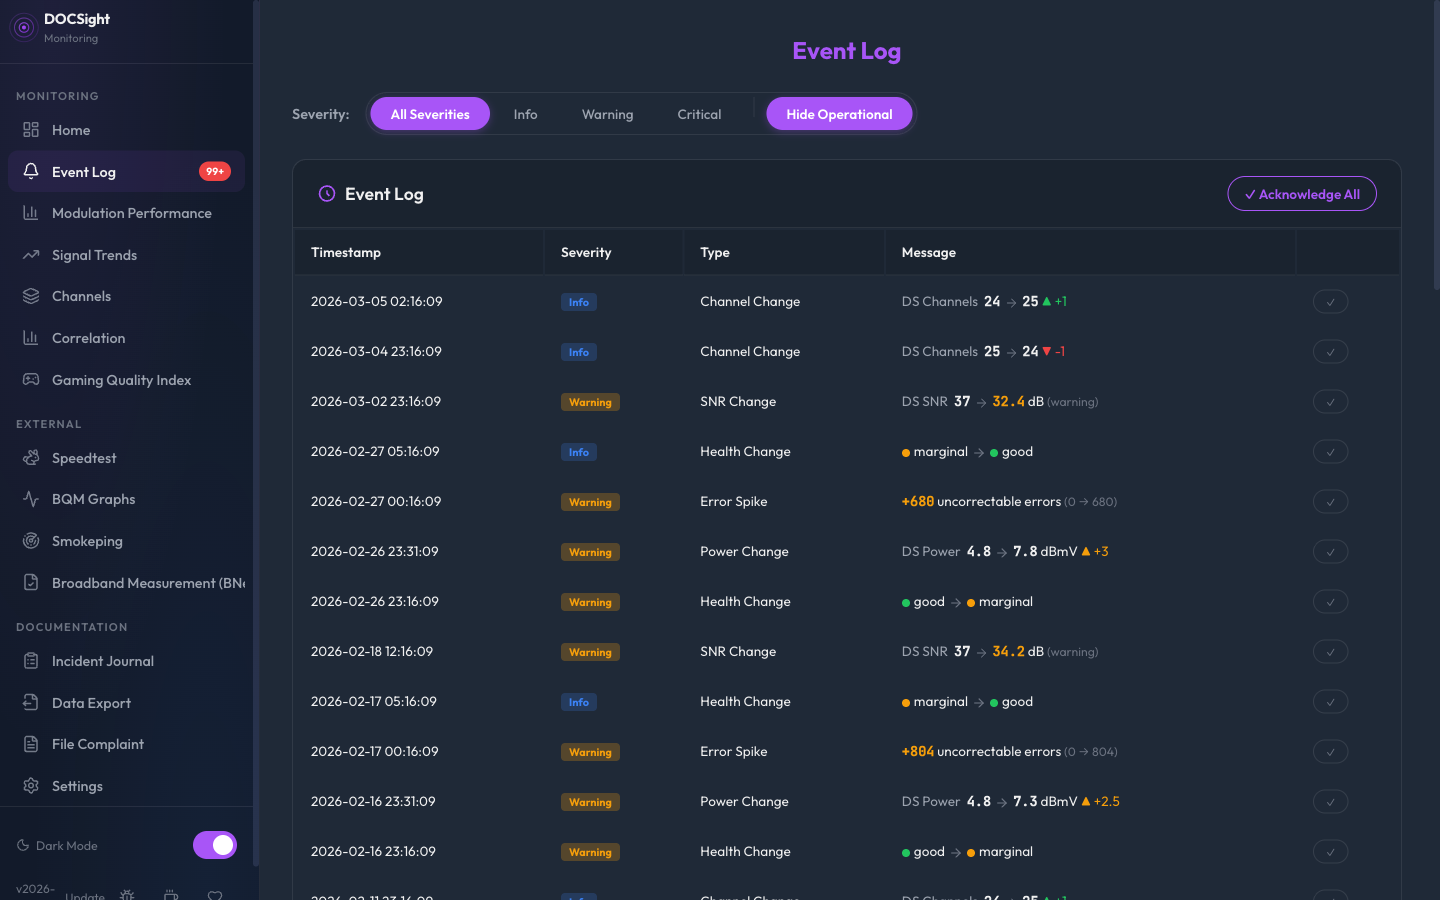
The 5 most recent events from the last 24 hours appear below the health banner on the dashboard. This gives you an at-a-glance view of recent changes without navigating to the full log.
The complete Event Log is accessible from the sidebar under Monitoring:
- Filter by severity (info/warning/critical) and event type
- Acknowledge individual events or all at once to mark them as reviewed
- Badge: Unacknowledged event count appears as a red badge in the sidebar
- Pagination for browsing large event histories
If your connection hovers near a threshold boundary (e.g., SNR fluctuating around 38 dB between "tolerated" and "marginal"), the event log can fill up with repeated state toggles even though the connection is perfectly stable. Health hysteresis prevents this flapping.
How it works: When enabled, a health state change only triggers after N consecutive polls confirm the new state. If the value bounces back before reaching the threshold count, no event is emitted. This applies to both degradations and recoveries.
Configuration: Settings > Notifications > Health Hysteresis, or via HEALTH_HYSTERESIS env var. Set to the number of consecutive polls required (recommended: 3). Default is 0 (instant, no hysteresis).
Example with hysteresis=3 at 15-minute polling:
| Poll | Health | Result |
|---|---|---|
| 1 | marginal | Pending (1/3) |
| 2 | tolerated | Reset (bounced back) |
| 3 | marginal | Pending (1/3) |
| 4 | marginal | Pending (2/3) |
| 5 | marginal | Confirmed, event emitted |
Without hysteresis, this sequence would produce 4 health_change events. With hysteresis=3, it produces 1.
Events can trigger webhook notifications to external services (Discord, ntfy, Gotify, or custom endpoints). See Configuration for notification setup. Events are filtered by severity before sending, so you can choose to only be notified about warnings and critical events.